图数据库Nebula_Graph界面工具安装与使用
1. NebulaGraph Studio-数据操作
1-1. NebulaGraph Studio简介
NebulaGraph Studio(简称 Studio)是一款可以通过 Web 访问的开源图数据库可视化工具,是 Nebula Graph 官方提供的图形用户界面(GUI)工具,它提供了更直观的方式来管理和查询图数据库。Nebula Studio 支持可视化的模式管理、数据查询、图可视化、数据导入导出等功能,使用户能够更轻松地操作数据库。
1-2. 产品功能
- 使用
Schema管理功能,用户可以使用图形界面完成图空间、Tag(标签)、Edge Type(边类型)、索引的创建,查看图空间的统计数据,快速上手 NebulaGraph。 - 使用导入功能,通过简单的配置,用户即能批量导入点和边数据,并能实时查看数据导入日志。
- 使用控制台功能,用户可以使用 nGQL 语句创建 Schema,并对数据执行增删改查操作。
1-3. 适用场景
- 已经安装部署了 NebulaGraph 数据库,想使用 GUI 工具创建 Schema、导入数据、执行 nGQL 语句查询。
- 不习惯用命令行工具,更希望使用 GUI 工具查看语句输出的结果
1-4. 版本兼容性
下面是经过格式化的内容:
| NebulaGraph 版本 | Studio 版本 |
|---|---|
| 3.4.0 | 3.6.0、3.5.1、3.5.0 |
| 3.3.0 | 3.5.1、3.5.0 |
| 3.0.0 ~ 3.2.x | 3.4.1、3.4.0 |
| 3.1.0 | 3.3.2 |
| 3.0.0 | 3.2.x |
| 2.6.x | 3.1.x |
| 2.6.x | 3.1.x |
| 2.0 & 2.0.1 | 2.x |
| 1.x | 1.x |
1-5. 安装与部署
确定Studio版本,我的Nebula版本为3.4.0,所以Studio使用了3.6.0版本部署
- 确保以下端口
7001未被占用,否则需要更改配置- 7001端口为Studio 提供 web 服务使用
- 默认安装路径为
/usr/local/nebula-graph-studio
x# 下载安装包[root@hdt-dmcp-ops01 ~]# wget https://oss-cdn.nebula-graph.com.cn/nebula-graph-studio/3.6.0/nebula-graph-studio-3.6.0.x86_64.rpm
# 查看安装包:nebula-graph-studio-3.6.0.x86_64.rpm[root@hdt-dmcp-ops01 ~]# ls -hl nebula-graph-*-rw-r--r-- 1 root root 81M Sep 12 11:02 nebula-graph-3.4.0.el7.x86_64.tar.gz-rw-r--r-- 1 root root 19M Sep 18 14:09 nebula-graph-studio-3.6.0.x86_64.rpm
# rpm直接安装,默认端口采用: 7001,如已占用,可以改默认配置# 指定安装路径加--prefix参数:rpm -i nebula-graph-studio-3.6.0.x86_64.rpm --prefix=<path> [root@hdt-dmcp-ops01 ~]# rpm -i nebula-graph-studio-3.6.0.x86_64.rpmStart installing NebulaGraph Studio now...NebulaGraph Studio has been installed.Created symlink from /etc/systemd/system/multi-user.target.wants/nebula-graph-studio.service to /usr/lib/systemd/system/nebula-graph-studio.service.NebulaGraph Studio started automatically.
# 查看服务运行情况[root@hdt-dmcp-ops01 nebula-graph-studio]# netstat -tnlpu|grep 7001tcp6 0 0 :::7001 :::* LISTEN 23659/server [root@hdt-dmcp-ops01 nebula-graph-studio]# ps -ef | grep 23659 | grep -v greproot 23659 1 0 14:14 ? 00:00:00 /usr/local/nebula-graph-studio/server
1-6. 使用介绍
- 启停服务
xxxxxxxxxx# 停止服务[root@hdt-dmcp-ops01 ~]# systemctl stop nebula-graph-studio.service
# 启动服务[root@hdt-dmcp-ops01 ~]# systemctl start nebula-graph-studio.service
# 重启服务[root@hdt-dmcp-ops01 ~]# systemctl restart nebula-graph-studio.service
也可以通过手动的方式操作
手动启动服务
xxxxxxxxxxbash /usr/local/nebula-graph-studio/scripts/rpm/start.sh手动停止服务
xxxxxxxxxxbash /usr/local/nebula-graph-studio/scripts/rpm/stop.sh
- 更改端口位置
xxxxxxxxxx[root@hdt-dmcp-ops01 ~]# cd /usr/local/nebula-graph-studio/etc/[root@hdt-dmcp-ops01 etc]# lltotal 4-rw-r--r-- 1 root root 372 Feb  6  2023 studio-api.yaml[root@hdt-dmcp-ops01 etc]# cat studio-api.yaml |grep PortPort: 7001
# 将7001更换即可
- 卸载Studio方式
如不再使用Studio界面工具,可以使用如下命令进行卸载
xxxxxxxxxx[root@hdt-dmcp-ops01 ~]# rpm -e nebula-graph-studio-3.6.0.x86_64
- 登录界面
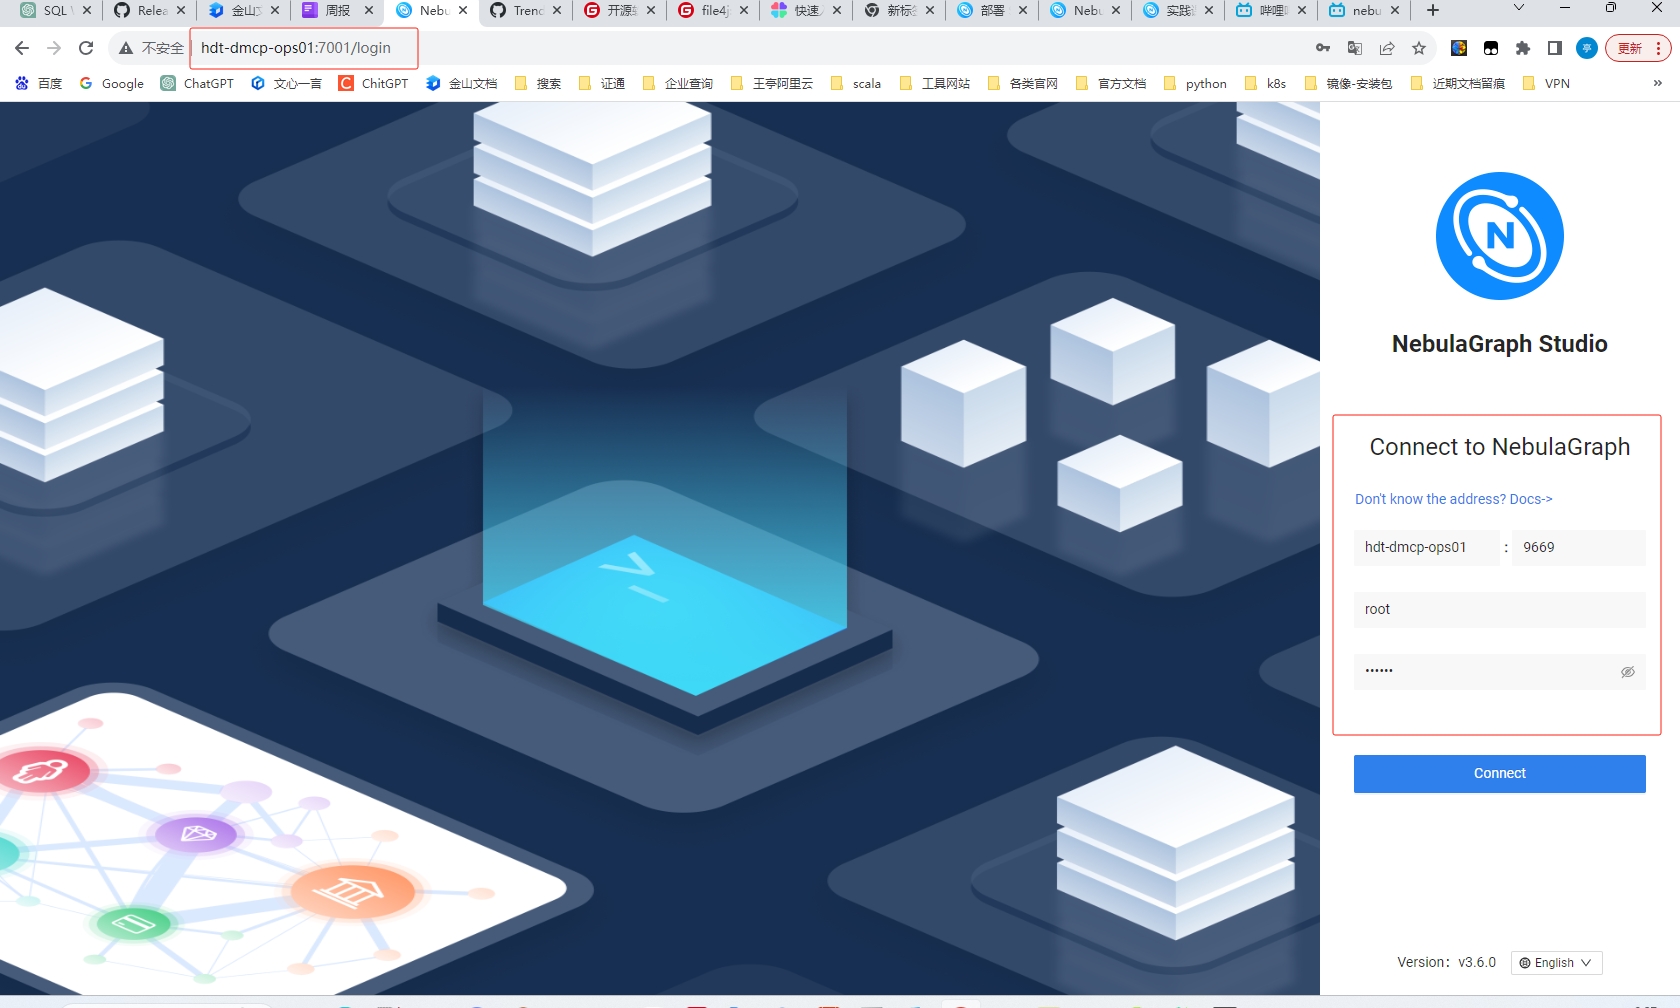
IP:Graph 服务的IP地址,如果本地hosts中有映射可以写主机名
Port:raphd 服务的端口。默认为
9669用户名&密码:根据 NebulaGraph 的身份验证设置填写登录账号和密码
- 使用界面
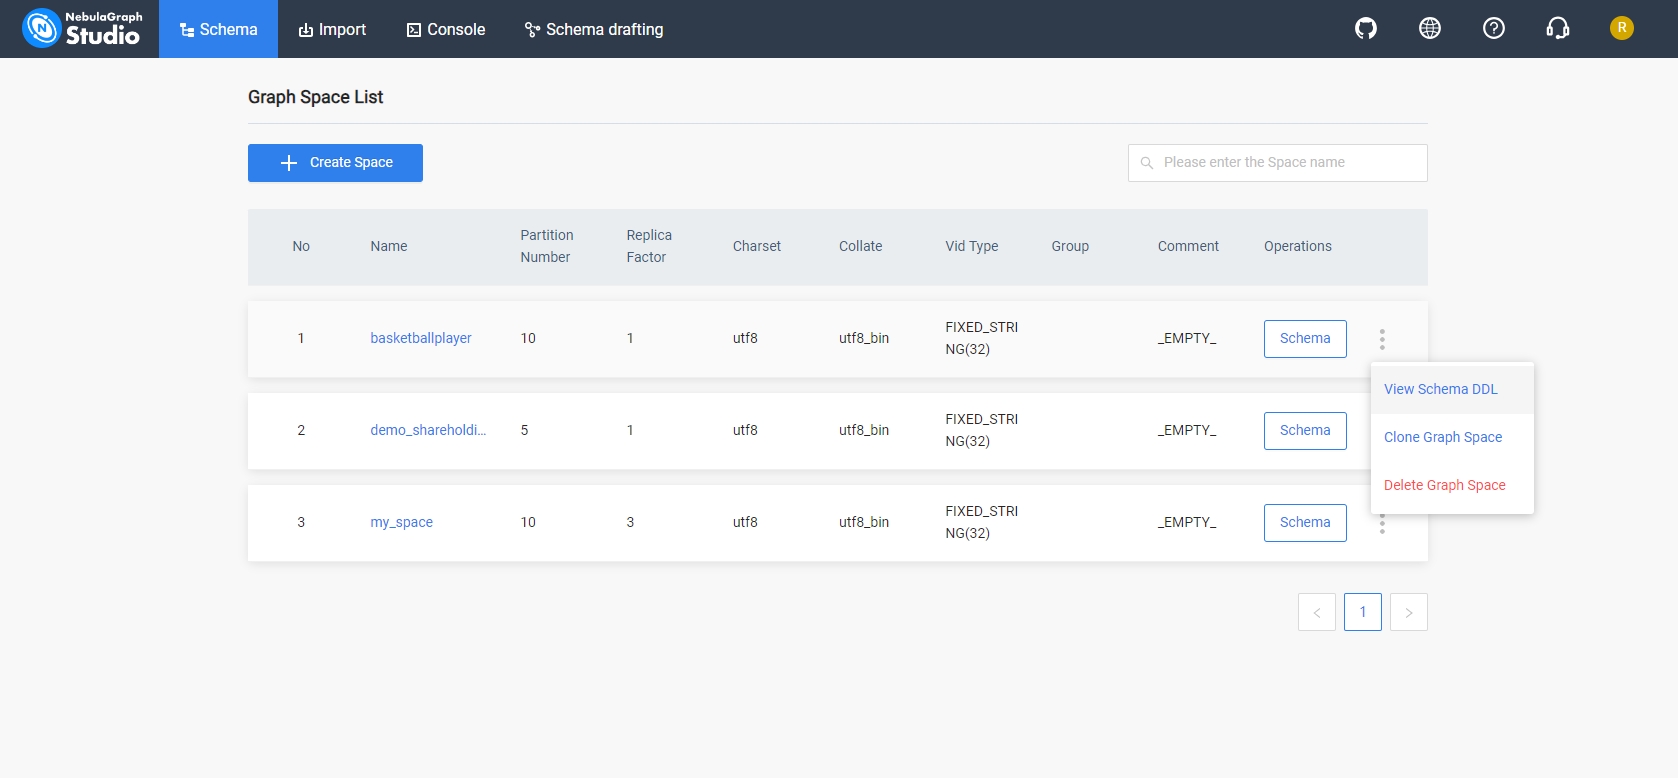
- Schema #管理Schema
- Import #可以在建好Schema后,导入数据文件
- Console #进行语句查询,并结果展示
- Schema drafting #Schema草图
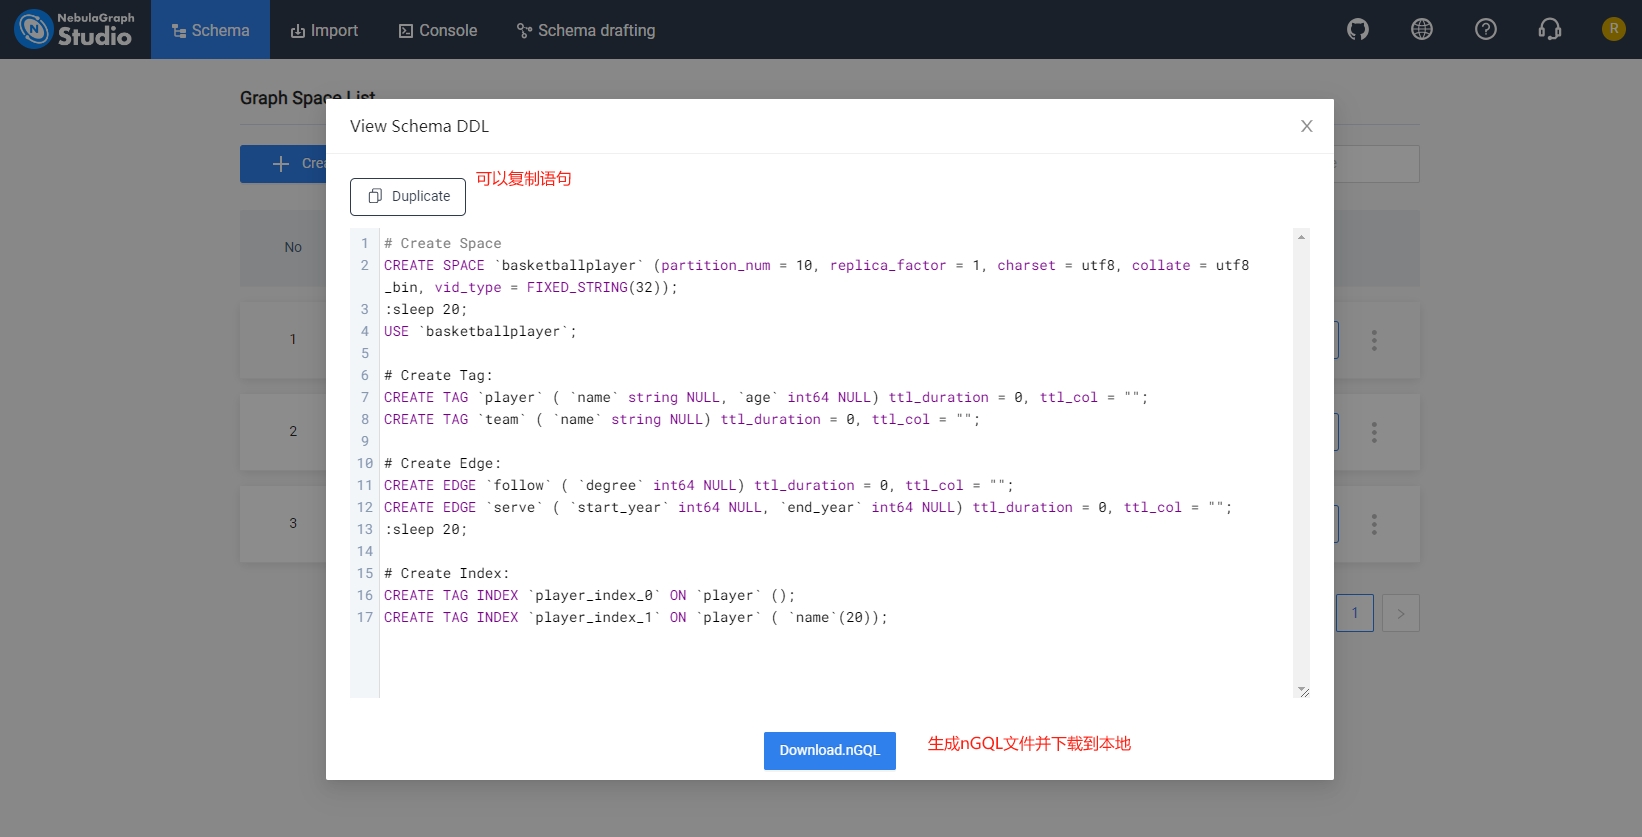
便捷的Schema DDL移植
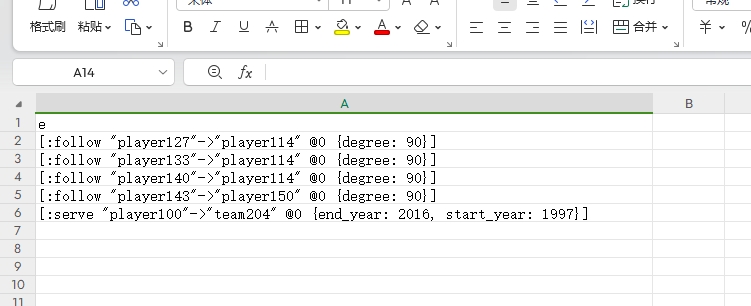
查询可以点击Table展示数据,也可以点击Graph展示图形

查询数据集可以导出至csv文件以及图片png文件
-

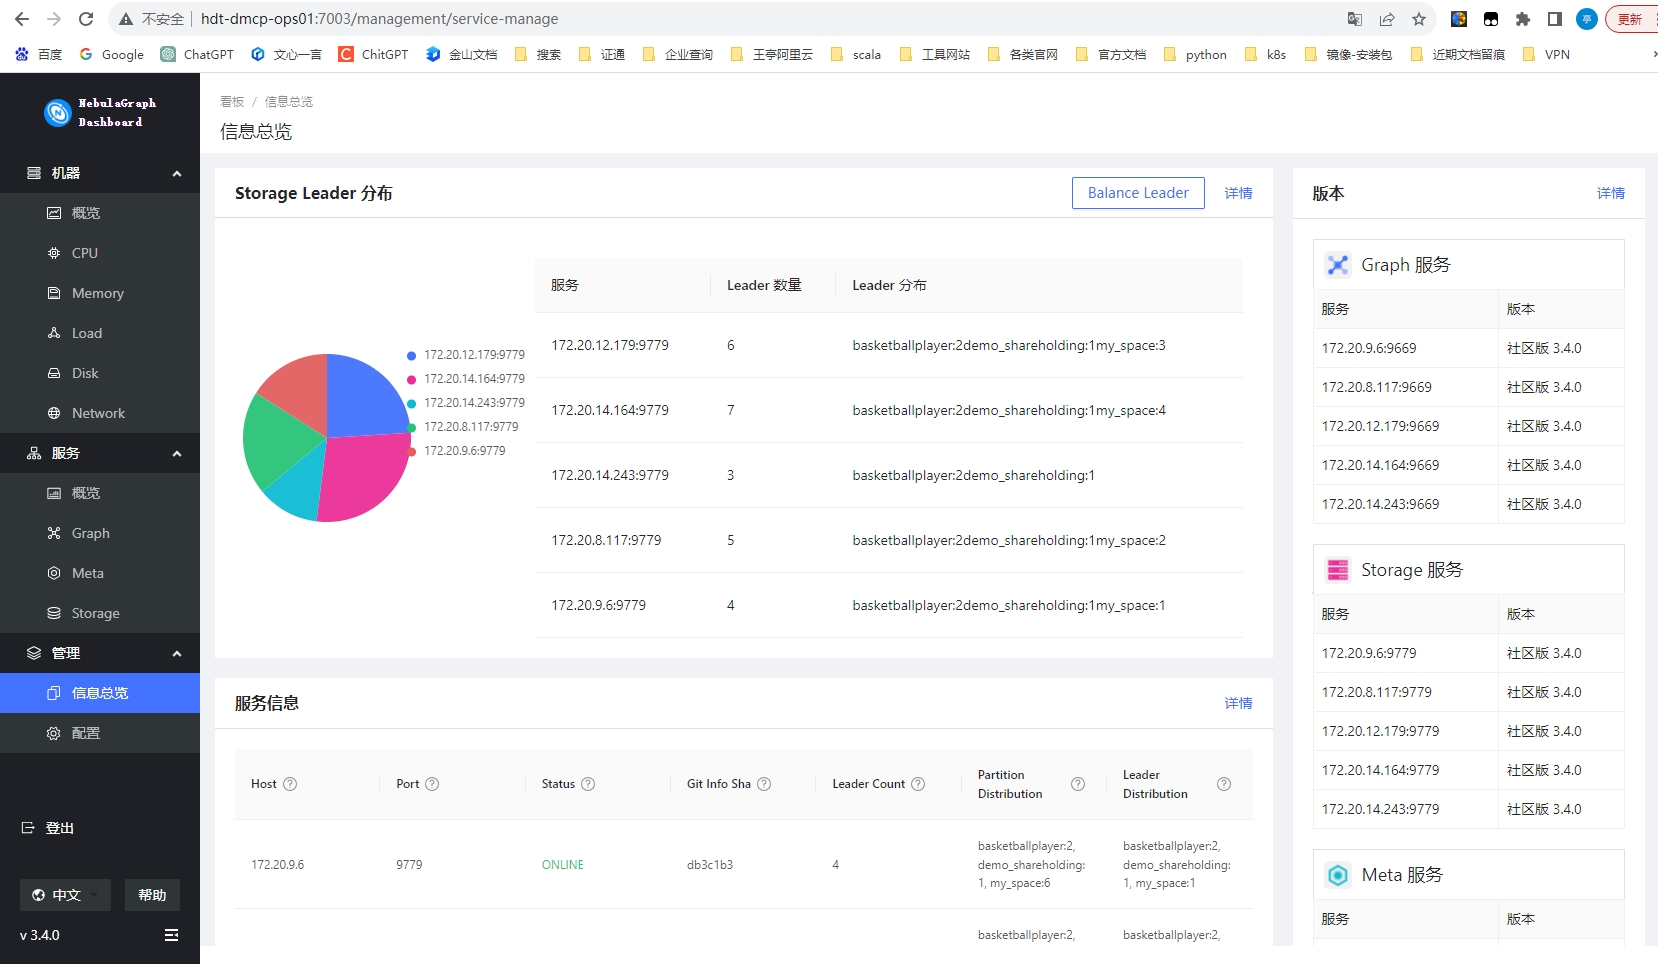
2. NebulaGraph Dashboard-集群监控
2-1. Nebula Graph Dashboard简介
Nebula Graph Dashboard 是 Nebula Graph 数据库的可视化管理工具,它提供了一个直观的图形用户界面(GUI)来监控、管理和操作 Nebula Graph 集群。Dashboard 旨在简化数据库管理任务,使用户能够轻松地执行各种操作,包括集群状态监控、模式管理、数据查询、用户权限管理等。
2-2. 产品功能
- 监控集群中所有机器的状态,包括 CPU、内存、负载、磁盘和流量。
- 监控集群中所有服务的信息,包括服务 IP 地址、版本和监控指标(例如查询数量、查询延迟、心跳延迟等)。
- 监控集群本身的信息,包括集群的服务信息、分区信息、配置和长时任务。
- 支持全局调整监控数据的页面更新频率。
2-3. 适用场景
- 需要方便快捷地监测关键指标,集中呈现业务的多个重点信息,保证业务正常运行。
- 需要多维度(例如时间段、聚合规则、指标)监控集群。
- 故障发生后,需要复盘问题,确认故障发生时间、异常现象。
2-4. 版本兼容性
| NebulaGraph 版本 | Dashboard 版本 |
|---|---|
| 3.4.0 | 3.4.0、3.2.0 |
| 3.3.0 | 3.2.0 |
| 2.5.0 ~ 3.2.0 | 3.1.0 |
| 2.5.x ~ 3.1.0 | 1.1.1 |
| 2.0.1 ~ 2.5.1 | 1.0.2 |
| 2.0.1 ~ 2.5.1 | 1.0.1 |
2-5. 安装与部署
前提条件
NebulaGraph 服务已经部署并启动,NebulaGraph集群运行正常
确保以下端口未被使用:
9200
- nebula-stats-exporter:收集集群的性能指标,包括服务 IP 地址、版本和监控指标(例如查询数量、查询延迟、心跳延迟 等)
9100
- node-exporter:收集集群中机器的资源信息,包括 CPU、内存、负载、磁盘和流量
9090
- prometheus:存储监控数据的时间序列数据库
8090
- nebula-http-gateway:为集群服务提供 HTTP 接口,执行 nGQL 语句与 NebulaGraph 数据库进行交互
7003
- Web服务
待监控的机器上已经安装 node-exporter
xxxxxxxxxx下载地址:https://github.com/prometheus/node_exporter/releases/例如:wget https://github.com/prometheus/node_exporter/releases/download/v1.6.1/node_exporter-1.6.1.linux-amd64.tar.gztar xvfz node_exporter-1.6.1.linux-amd64.tar.gzcd node_exporter-1.6.1.linux-amd64./node_exporter
- 安装
xxxxxxxxxx# 下载[root@hdt-dmcp-ops01 ~]# wget https://oss-cdn.nebula-graph.com.cn/nebula-graph-dashboard/3.4.0/nebula-dashboard-3.4.0.x86_64.tar.gz
# 解压[root@hdt-dmcp-ops01 ~]# tar -xvf nebula-dashboard-3.4.0.x86_64.tar.gz -C /usr/local/[root@hdt-dmcp-ops01 ~]# cd /usr/local/nebula-dashboard/
- 配置文件
模版:
xxxxxxxxxxport7003 # Web 服务端口。gateway iphostIP # 部署 Dashboard 的机器 IP。 port8090 httpsfalse # 是否为 HTTPS 端口。 runmodedev # 程序运行模式,包括 dev、test、prod。一般用于区分不同运行环境。stats-exporter iphostIP # 部署 Dashboard 的机器 IP。 nebulaPort9200 httpsfalse # 是否为 HTTPS 端口。node-exporteripnebulaHostIP_1 # 部署 NebulaGraph 的机器 IP。 port9100 httpsfalse # 是否为 HTTPS 端口。# - ip: nebulaHostIP_2# port: 9100# https: falseprometheus iphostIP # 部署 Dashboard 的机器 IP。 prometheusPort9090 httpsfalse # 是否为 HTTPS 端口。 scrape_interval5s # 收集监控数据的间隔时间。默认为 1 分钟。 evaluation_interval5s # 告警规则扫描时间间隔。默认为 1 分钟。# 集群节点信息nebula-cluster name'default' # 集群名称 metadnamemetad0 endpointIPnebulaMetadIP # 部署 Meta 服务的机器 IP。 port9559 endpointPort19559 # - name: metad1 # endpointIP: nebulaMetadIP # port: 9559 # endpointPort: 19559 graphdnamegraphd0 endpointIPnebulaGraphdIP # 部署 Graph 服务的机器 IP。 port9669 endpointPort19669 # - name: graphd1 # endpointIP: nebulaGraphdIP # port: 9669 # endpointPort: 19669 storagednamestoraged0 endpointIPnebulaStoragedIP # 部署 Storage 服务的机器 IP。 port9779 endpointPort19779 # - name: storaged1 # endpointIP: nebulaStoragedIP # port: 9779 # endpointPort: 19779 示例:
xxxxxxxxxxport7003 # Web service port.gateway ip172.20.8.117 # The IP of the machine where the Dashboard is deployed. port8090 httpsfalse # Whether to enable HTTPS. runmodedev # Program running mode, including dev, test, and prod. It is used to distinguish between different running environments generally.stats-exporter ip172.20.8.117 # The IP of the machine where the Dashboard is deployed. nebulaPort9200 httpsfalse # Whether to enable HTTPS.node-exporterip172.20.8.117 # The IP of the machine where the NebulaGraph is deployed. port9100 httpsfalse # Whether to enable HTTPS.ip172.20.14.164 port9100 httpsfalseip172.20.14.243 port9100 httpsfalseip172.20.9.6 port9100 httpsfalseip172.20.12.179 port9100 httpsfalseprometheus ip172.20.8.117 # The IP of the machine where the Dashboard is deployed. prometheusPort9090 httpsfalse # Whether to enable HTTPS. scrape_interval5s # The interval for collecting the monitoring data, which is 1 minute by default. evaluation_interval5s # The interval for running alert rules, which is 1 minute by default.# Cluster node infonebula-cluster name'wangting_nebula_cluster' # Cluster name metadnamemetad-hdt-dmcp-ops01 endpointIP172.20.8.117 # The IP of the machine where the Meta service is deployed. port9559 endpointPort19559namemetad-hdt-dmcp-ops02 endpointIP172.20.14.164 port9559 endpointPort19559 namemetad-hdt-dmcp-ops03 endpointIP172.20.14.243 port9559 endpointPort19559 graphdnamegraphd-hdt-dmcp-ops01 endpointIP172.20.8.117 # The IP of the machine where the Graph service is deployed. port9669 endpointPort19669namegraphd-hdt-dmcp-ops02 endpointIP172.20.14.164 port9669 endpointPort19669namegraphd-hdt-dmcp-ops03 endpointIP172.20.14.243 port9669 endpointPort19669namegraphd-hdt-dmcp-ops04 endpointIP172.20.9.6 port9669 endpointPort19669namegraphd-hdt-dmcp-ops05 endpointIP172.20.12.179 port9669 endpointPort19669 storagednamestoraged-hdt-dmcp-ops01 endpointIP172.20.8.117 # The IP of the machine where the Storage service is deployed. port9779 endpointPort19779namestoraged-hdt-dmcp-ops02 endpointIP172.20.14.164 port9779 endpointPort19779 namestoraged-hdt-dmcp-ops03 endpointIP172.20.14.243 port9779 endpointPort19779namestoraged-hdt-dmcp-ops04 endpointIP172.20.9.6 port9779 endpointPort19779namestoraged-hdt-dmcp-ops05 endpointIP172.20.12.179 port9779 endpointPort19779
- 启动服务
xxxxxxxxxx# 启动运行[root@hdt-dmcp-ops01 nebula-dashboard]# ./dashboard.service start all[INFO] Starting prometheus[INFO] DONE[INFO] Starting http-gateway[INFO] DONE[INFO] Starting nebula-dashboard-server[INFO] DONE[INFO] Starting nebula-stats-exporter[INFO] DONE
# 查看各组件端口是否启动[root@hdt-dmcp-ops01 nebula-dashboard]# netstat -tnlpu|grep -E "9200|9100|8090|9090|7003"  tcp6       0      0 :::9100                 :::*                    LISTEN      839/node_exporter   tcp6       0      0 :::9200                 :::*                    LISTEN      13101/nebula-stats- tcp6       0      0 :::8090                 :::*                    LISTEN      13084/nebula-httpd  tcp6       0      0 :::7003                 :::*                    LISTEN      13085/webserver     tcp6       0      0 :::9090                 :::*                    LISTEN      13083/prometheus
2-6. 使用介绍
- 启停服务
xxxxxxxxxx# dashboard.service不带参数时,提示<start|restart|stop|status>[root@hdt-dmcp-ops01 nebula-dashboard]# ./dashboard.service Usage: dashboard [options] [command]
Options:  -v --version       NebulaGraph Dashboard version  -h, --help         display help for command
Commands:  start <service>    start service, all|gateway|stats-exporter|prometheus|webserver  stop <service>     stop service, all|gateway|stats-exporter|prometheus|webserver  status <service>   status service, all|gateway|stats-exporter|prometheus|webserver  restart <service>  restart service, all|gateway|stats-exporter|prometheus|webserver  help [command]     display help for command
参数表:
| 参数 | 说明 |
|---|---|
| dashboard_path | Dashboard 安装路径 |
| -v | 显示详细调试信息 |
| -h | 显示帮助信息 |
| start | 启动服务 |
| restart | 重启服务 |
| stop | 停止服务 |
| status | 查看服务状态 |
| prometheus | 管理 prometheus 服务 |
| webserver | 管理 webserver 服务 |
| exporter | 管理 exporter 服务 |
| gateway | 管理 gateway 服务 |
| all | 管理所有服务 |
示例:
xxxxxxxxxx[root@hdt-dmcp-ops01 nebula-dashboard]# ./dashboard.service status all[INFO] prometheus is running, pid is 13083[INFO] http-gateway is running, pid is 13084[INFO] nebula-dashboard-server is running, pid is 13085[INFO] nebula-stats-exporter is running, pid is 13101
[root@hdt-dmcp-ops01 nebula-dashboard]# ./dashboard.service status webserver[INFO] nebula-dashboard-server is running, pid is 13085
[root@hdt-dmcp-ops01 nebula-dashboard]# ./dashboard.service -versionNebulaGraph Dashboard Community v3.4.0
[root@hdt-dmcp-ops01 nebula-dashboard]# ./dashboard.service restart all[INFO] Stopping prometheus[INFO] PID info is 13083[INFO] Done[INFO] Starting prometheus[INFO] DONE[INFO] Stopping http-gateway[INFO] PID info is 13084[INFO] Done[INFO] Starting http-gateway[INFO] DONE[INFO] Stopping nebula-dashboard-server[INFO] PID info is 13085[INFO] Done[INFO] Starting nebula-dashboard-server[INFO] DONE[INFO] Stopping nebula-stats-exporter[INFO] PID info is 13101[INFO] Done[INFO] Starting nebula-stats-exporter[INFO] DONE
- 登录界面(IP:7003端口)
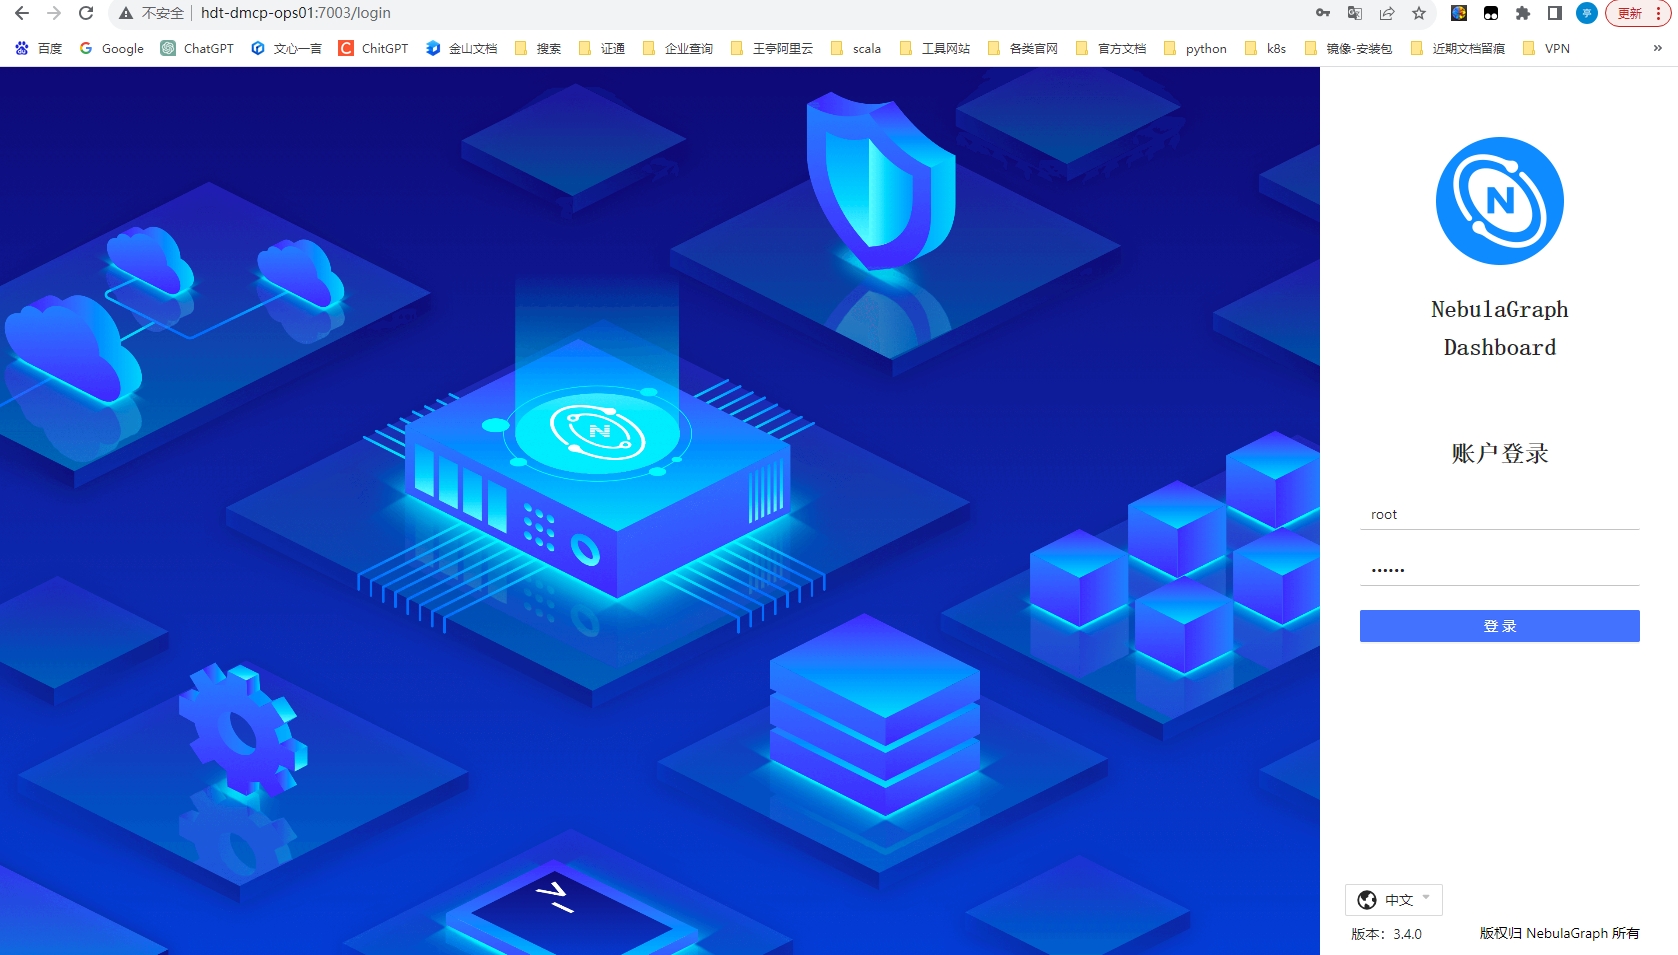
输入 NebulaGraph 数据库的账号和密码