pandas模块使用介绍
1.pandas简介
pandas 是基于NumPy 的一种工具,该工具是为解决数据分析任务而创建的。Pandas 纳入了大量库和一些标准的数据模型,提供了高效地操作大型数据集所需的工具。pandas提供了大量能使我们快速便捷地处理数据的函数和方法。
Python在数据处理和准备⽅⾯⼀直做得很好,但在数据分析和建模⽅⾯就差⼀些。pandas帮助填补了这⼀空⽩,使您能够在Python中执⾏整个数据分析⼯作流程,⽽不必切换到更特定于领域的其它语⾔
与出⾊的 jupyter⼯具包和其他库相结合,Python中⽤于进⾏数据分析的环境在性能、⽣产率和协作能⼒⽅⾯都是卓越的
pandas是 Python 的核⼼数据分析⽀持库,提供了快速、灵活、明确的数据结构,旨在简单、直观地处理关系型、标记型数据。pandas是Python进⾏数据分析的必备⾼级⼯具。
pandas的主要数据结构是 Series(⼀维数据)与 DataFrame (⼆维数据),这两种数据结构⾜以处理⾦融、统计、社会科学、⼯程等领域⾥的⼤多数案例
处理数据⼀般分为⼏个阶段:
- 数据整理与清洗
- 数据分析与建模
- 数据可视化与制表
pandas模块安装:pip install pandas -i https://pypi.tuna.tsinghua.edu.cn/simple
-i 指定pip源,使用国内pip提高下载安装速度、
2.pandas数据结构
2-1.Series(⼀维数据)
⽤列表⽣成 Series时,Pandas 默认⾃动⽣成整数索引,也可以指定索引
代码示例1:
ximport numpy as npimport pandas as pd
list_info = [0, 1, 7, 9, np.NAN, None, 1024, 512]s1 = pd.Series(data=list_info)print(s1)
""" 输出结果0 0.01 1.02 7.03 9.04 NaN5 NaN6 1024.07 512.0dtype: float64"""
- ⽆论是numpy中的np.NAN,还是Python中的None在pandas中都以缺失数据NaN对待
- pandas⾃动添加索引项
- 不指定dtype,默认值为dtype='float64'
代码示例2:
xxxxxxxxxximport numpy as npimport pandas as pd
list_info = [0, 1, 7, 9, np.NAN, None, 1024, 512]s2 = pd.Series(data=list_info, index=list('abcdefghijklmnopqrstuvwxyz')[:len(list_info)], dtype='float32')print(s2)
""" 输出结果a       0.0b       1.0c       7.0d       9.0e       NaNf       NaNg    1024.0h     512.0dtype: float32"""
1.可以自行指定⾏索引
代码示例3:
xxxxxxxxxximport pandas as pd
s3 = pd.Series(data={'wow': "魔兽世界", 'ow': "守望先锋", 'diablo': "暗黑破坏神"}, name='Blizzard_game', dtype='str')print(s3)
""" 输出结果wow        魔兽世界ow         守望先锋diablo    暗黑破坏神Name: Blizzard_game, dtype: object"""
1.可以传⼊字典创建,key⾏为索引,value为数据
2-2.DataFrame(二维数据)
DataFrame是由多种类型的列构成的⼆维标签数据结构,类似于 Excel 、SQL 表,或 Series 对象构成的字典
代码示例1:
xxxxxxxxxximport pandas as pd
df1 = pd.DataFrame(data={'腾讯': ["英雄联盟", "王者荣耀", "地下城与勇士"],                         '网易': ["魔兽世界", "守望先锋", "暗黑破坏神"],                         '盛大': ["龙之谷", "传奇世界", "星辰变"]},                   index=['小美', '小丽', '小兔'])print(df1)""" 输出结果        腾讯     网易    盛大小美    英雄联盟   魔兽世界   龙之谷小丽    王者荣耀   守望先锋  传奇世界小兔  地下城与勇士  暗黑破坏神   星辰变"""
1.index 作为⾏索引
2.字典中的key作为列索引
3.通过数据创建了3*3的DataFrame表格⼆维数组
代码示例2:
xxxxxxxxxximport numpy as npimport pandas as pd
df2 = pd.DataFrame(data=np.random.randint(0, 151, size=(5, 3)),                   index=['周杰伦', '林俊杰', '周润发', '张绍忠', '唐国强'],                   columns=['语文', '数学', '外语'])print(df2)""" 输出结果      语文   数学   外语周杰伦  107   59  114林俊杰  148  137   24周润发   83    3   19张绍忠   89  147   56唐国强  123   30  123"""
3.查看数据
查看DataFrame的常⽤属性和DataFrame的概览和统计信息
代码示例:
xxxxxxxxxximport numpy as npimport pandas as pd
df = pd.DataFrame(data=np.random.randint(0, 101, size=(12, 3)), index=None, columns=['语文', '数学', '外语'])print("----- print(df) -----")print(df)
print("----- df.head(4) -----")print(df.head(4))
print("----- df.tail(4) -----")print(df.tail(4))
# 查看形状,⾏数和列数print("----- df.shape -----")print(df.shape)
# 查看数据类型print("----- df.dtypes -----")print(df.dtypes)
# 查看行索引print("----- df.index -----")print(df.index)
# 查看列索引print("----- df.columns -----")print(df.columns)
# 对象值,⼆维ndarray数组print("----- df.values -----")print(df.values)
# # 查看数值型列的汇总统计,计数、平均值、标准差、最⼩值、四分位数、最⼤值print("----- df.describe() -----")print(df.describe())
# 查看列索引、数据类型、⾮空计数和内存信息print("----- df.info() -----")print(df.info())
""" 输出结果----- print(df) -----    语文  数学  外语0   27  19  301   56   2  922   81  42  243   72  18  444   50  23   35   18   4  946   13  83  967   90  76  738   38  12  869   39   8  5210  18   0  1011  68  30  48
----- df.head(4) -----   语文  数学  外语0  27  19  301  56   2  922  81  42  243  72  18  44
----- df.tail(4) -----    语文  数学  外语8   38  12  869   39   8  5210  18   0  1011  68  30  48
----- df.shape -----(12, 3)
----- df.dtypes -----语文    int32数学    int32外语    int32dtype: object
----- df.index -----RangeIndex(start=0, stop=12, step=1)
----- df.columns -----Index(['语文', '数学', '外语'], dtype='object')
----- df.values -----[[27 19 30] [56  2 92] [81 42 24] [72 18 44] [50 23  3] [18  4 94] [13 83 96] [90 76 73] [38 12 86] [39  8 52] [18  0 10] [68 30 48]] ----- df.describe() -----              语文         数学         外语count  12.000000  12.000000  12.000000mean   47.500000  26.416667  54.333333std    26.182923  27.628899  33.499887min    13.000000   0.000000   3.00000025%    24.750000   7.000000  28.50000050%    44.500000  18.500000  50.00000075%    69.000000  33.000000  87.500000max    90.000000  83.000000  96.000000
----- df.info() -----<class 'pandas.core.frame.DataFrame'>RangeIndex: 12 entries, 0 to 11Data columns (total 3 columns): #   Column  Non-Null Count  Dtype---  ------  --------------  ----- 0   语文      12 non-null     int32 1   数学      12 non-null     int32 2   外语      12 non-null     int32dtypes: int32(3)memory usage: 272.0 bytesNone"""
4.数据的输入与输出
4-1.CSV
4-1-1.数据写入CSV
代码示例:
xxxxxxxxxximport numpy as npimport pandas as pd
df = pd.DataFrame(data=np.random.randint(0, 50, size=[3, 5]),                  columns=['IT', '化⼯', '⽣物', '教师', '⼠兵'])# 查看数据print(df)
df.to_csv('./20221205_info.csv',          sep=',',          header=True,          index=True)
""" 输出结果   IT  化⼯  ⽣物  教师  ⼠兵0   31   24   49   23    31    9    1   27   31    42   20   30    7   32   24"""
sep = ',' # ⽂本分隔符,默认是逗号
header = True # 是否保存列索引
index = True # 是否保存⾏索引,保存⾏索引,⽂件被加载时,默认⾏索引会作为⼀列
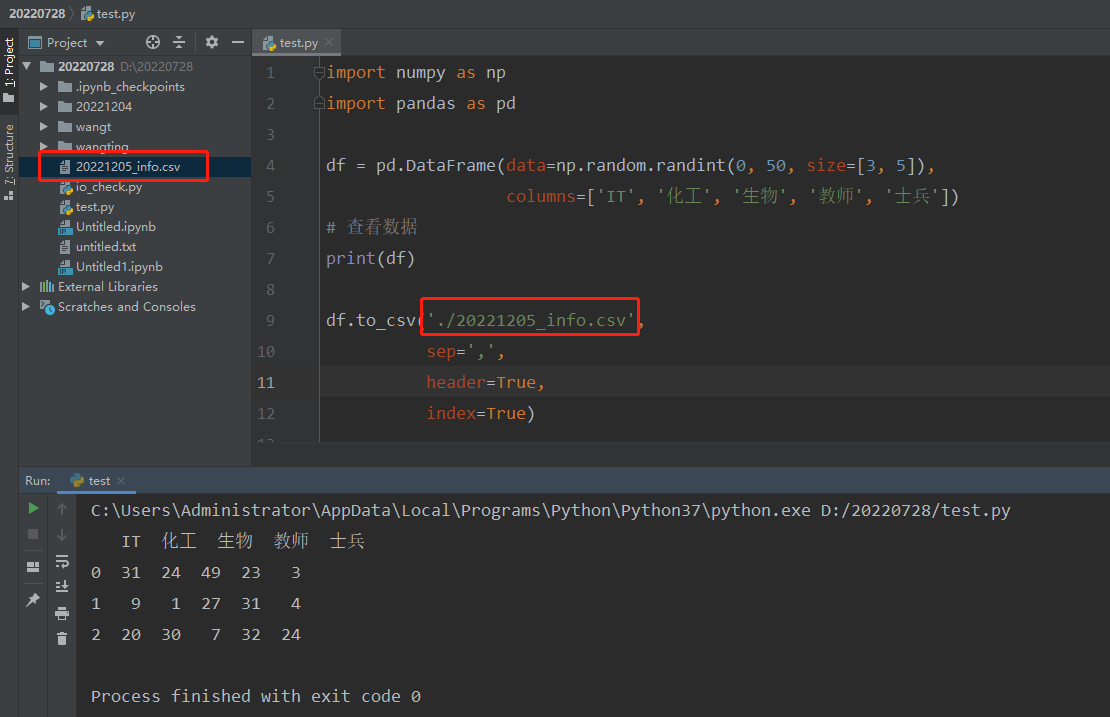
- 找到文件所在路径打开文件

4-1-2.读取CSV
- 使用read_csv
xxxxxxxxxximport pandas as pd
df = pd.read_csv('./20221205_info.csv',                 sep=',',                 header=[0],                 index_col=0)print(df)
""" 输出结果 IT 化⼯ ⽣物 教师 ⼠兵0 31 24 49 23 31 9 1 27 31 42 20 30 7 32 24"""- 使用read_table
xxxxxxxxxximport pandas as pd
df = pd.read_table('./20221205_info.csv',                   sep=',',                   header=[0],                   index_col=0)print(df)
""" 输出结果   IT  化⼯  ⽣物  教师  ⼠兵0   31   24   49   23    31    9    1   27   31    42   20   30    7   32   24"""
4-2.Excel
操作Excel文件需要安装相关的模块工具
xxxxxxxxxxpip install xlrd -i https://pypi.tuna.tsinghua.edu.cn/simplepip install xlwt -i https://pypi.tuna.tsinghua.edu.cn/simplepip install openpyxl -i https://pypi.tuna.tsinghua.edu.cn/simple
xlwt包可以正常使用,但是在使用时官方会提示警告:
FutureWarning: As the xlwt package is no longer maintained, the xlwt engine will be removed in a future version of pandas. This is the only engine in pandas that supports writing in the xls format. Install openpyxl and write to an xlsx file instead. You can set the option io.excel.xls.writer to 'xlwt' to silence this warning. While this option is deprecated and will also raise a warning, it can be globally set and the warning suppressed. index=False)
由于xlwt包不再维护,未来版本的panda将删除xlwt引擎。这是panda中唯一支持xls格式编写的引擎。后续可以安装openpyxl并改为写入xlsx文件来替代原来使用习惯
代码示例1:
单分页sheet
xxxxxxxxxximport numpy as npimport pandas as pd
df1 = pd.DataFrame(data=np.random.randint(0, 50, size=[3, 5]),                   columns=['IT', '化⼯', '⽣物', '教师', '⼠兵'])df1.to_excel('./20221206.xlsx',             sheet_name='salary',             header=True,             index=False)
df_info = pd.read_excel('./20221206.xlsx',                        sheet_name='salary',                        header=0,                        index_col=0)print(df_info)
""" 输出结果IT  化⼯  ⽣物  教师  ⼠兵26  33    2   15   4733   1   11   48   3926   7   24   30    0"""
代码示例2:
多分页sheet
xxxxxxxxxximport numpy as npimport pandas as pd
df1 = pd.DataFrame(data=np.random.randint(0, 50, size=[3, 5]),                   columns=['IT', '化⼯', '⽣物', '教师', '⼠兵'])df2 = pd.DataFrame(data=np.random.randint(0, 50, size=[4, 3]),                   columns=['Python', 'Tensorflow', 'Keras'])
with pd.ExcelWriter('./20221206_data.xlsx') as writer:    df1.to_excel(writer, sheet_name='salary', index=False)    df2.to_excel(writer, sheet_name='score', index=False)
data_salary = pd.read_excel('./20221206_data.xlsx',                            sheet_name='salary')print(data_salary)
data_score = pd.read_excel('./20221206_data.xlsx',                           sheet_name='score')print(data_score)
""" 输出结果    IT  化⼯  ⽣物  教师  ⼠兵0   43   31   17   33  281   17   15   44   26  432   47   21   15   19   3
   Python  Tensorflow  Keras0      48          32     161      14          30      32      10          28     363      42           1      1"""
4-3.SQL
操作SQL需要安装相关的模块工具
安装依赖组件模块、准备MySQL实验环境
xxxxxxxxxxpip install sqlalchemy -i https://pypi.tuna.tsinghua.edu.cn/simplepip install pymysql -i https://pypi.tuna.tsinghua.edu.cn/simple
xxxxxxxxxx[root@wangting ~]# mysql -uroot -p123456Welcome to the MariaDB monitor. Commands end with ; or \g.MariaDB [(none)]> create database pandas;Query OK, 1 row affected (0.000 sec)代码示例:
xxxxxxxxxximport pandas as pdimport numpy as npfrom sqlalchemy import create_engine
df = pd.DataFrame(data=np.random.randint(0, 50, size=[150, 3]),                  columns=['Python', 'Tensorflow', 'Keras'])conn = create_engine('mysql+pymysql://root:123456@172.192.55.12/pandas?charset=UTF8MB4')df.to_sql('score',          conn,          if_exists='append')
data = pd.read_sql('select * from score limit 5', conn,index_col=None)print(data)
""" 输出结果   index  Python  Tensorflow  Keras0      0       1           1     141      1      43          40     432      2       0           3     313      3      27           0     104      4      38          45     24"""
从MySQL中查看验证
xxxxxxxxxxMariaDB [(none)]> use pandas;Reading table information for completion of table and column namesYou can turn off this feature to get a quicker startup with -A
Database changedMariaDB [pandas]> show tables;+------------------+| Tables_in_pandas |+------------------+| score            |+------------------+1 row in set (0.000 sec)
MariaDB [pandas]> select * from score limit 3;+-------+--------+------------+-------+| index | Python | Tensorflow | Keras |+-------+--------+------------+-------+|     0 |      1 |          1 |    14 ||     1 |     43 |         40 |    43 ||     2 |      0 |          3 |    31 |+-------+--------+------------+-------+3 rows in set (0.000 sec)
MariaDB [pandas]> desc score;+------------+------------+------+-----+---------+-------+| Field      | Type       | Null | Key | Default | Extra |+------------+------------+------+-----+---------+-------+| index      | bigint(20) | YES  | MUL | NULL    |       || Python     | int(11)    | YES  |     | NULL    |       || Tensorflow | int(11)    | YES  |     | NULL    |       || Keras      | int(11)    | YES  |     | NULL    |       |+------------+------------+------+-----+---------+-------+4 rows in set (0.001 sec)
4-4.HDF5
- HDF5是⼀个独特的技术套件,可以管理⾮常⼤和复杂的数据收集。
- HDF5,可以存储不同类型数据的⽂件格式,后缀通常是.h5,它的结构是层次性的。
- ⼀个HDF5⽂件可以被看作是⼀个组包含了各类不同的数据集

-

对于HDF5⽂件中的数据存储,有两个核⼼概念:group 和 dataset
dataset 代表数据集,⼀个⽂件当中可以存放不同种类的数据集,这些数据集如何管理,就⽤到了group
最直观的理解,可以参考我们的⽂件管理系统,不同的⽂件位于不同的⽬录下。
⽬录就是HDF5中的group, 描述了数据集dataset的分类信息,通过group 有效的将多种dataset 进⾏管
理和区分;⽂件就是HDF5中的dataset, 表示的是具体的数据。
安装相关HDF5模块:
xxxxxxxxxxpip install tables -i https://pypi.tuna.tsinghua.edu.cn/simple
代码示例:
xxxxxxxxxximport numpy as npimport pandas as pd
df1 = pd.DataFrame(data=np.random.randint(0, 50, size=[4, 5]), columns=['IT', '化⼯', '⽣物', '教师', '⼠兵'])df2 = pd.DataFrame(data=np.random.randint(0, 50, size=[6, 3]), columns=['Python', 'Tensorflow', 'Keras'])df1.to_hdf('./data.h5', key='salary')df2.to_hdf('./data.h5', key='score')
salary_info = pd.read_hdf('./data.h5', key='salary')print(salary_info)
score_info = pd.read_hdf('./data.h5', key='score')print(score_info)
""" 输出结果   IT  化⼯  ⽣物  教师  ⼠兵0  30  43   4  21  231   9  39  37  48  412  29  36  39  31  463   7  40  27  14  48
   Python  Tensorflow  Keras0      22          49     231      47          18     252      17          17     313       2           1     244      33          38     165      14          21     47"""
5.数据选取
5-1.获取数据
xxxxxxxxxximport pandas as pdimport numpy as np
df = pd.DataFrame(data=np.random.randint(0, 150, size=[8, 3]), columns=['Chinese', 'Math', 'English'])print("----- print(df) -----")print(df)
# 获取单列,Seriesprint("----- df['Chinese'] -----")print(df['Chinese'])
# 获取单列,Seriesprint("----- df.English -----")print(df.English)
# 获取多列,DataFrameprint("----- df[['Chinese', 'English']] -----")print(df[['Chinese', 'English']])
# 行切片print("----- df[3:15] -----")print(df[3:15])
""" 输出结果----- print(df) -----   Chinese  Math  English0       87    24      1071       37    55        82       28    22       773       77   138       764       16    98       575       93    63       606      120    26       527       84     8      110
----- df['Chinese'] -----0     871     372     283     774     165     936    1207     84Name: Chinese, dtype: int32
----- df.English -----0    1071      82     773     764     575     606     527    110Name: English, dtype: int32
----- df[['Chinese', 'English']] -----   Chinese  English0       87      1071       37        82       28       773       77       764       16       575       93       606      120       527       84      110
----- df[3:15] -----   Chinese  Math  English3       77   138       764       16    98       575       93    63       606      120    26       527       84     8      110"""
5-2.标签选择
xxxxxxxxxximport pandas as pdimport numpy as np
df = pd.DataFrame(data=np.random.randint(0, 150, size=[10, 3]),                  index=list('ABCDEFGHIJ'), columns=['Chinese', 'Math', 'English'])
print("----- df -----")print(df)
# 选取指定⾏标签数据print("----- df.loc[['A', 'C', 'D', 'F']] -----")print(df.loc[['A', 'C', 'D', 'F']])
# 根据⾏标签切⽚,选取指定列标签的数据print("----- df.loc['A':'E', ['Chinese', 'English']] -----")print(df.loc['A':'E', ['Chinese', 'English']])
# :默认保留所有⾏print("----- df.loc[:, ['English', 'Math']] -----")print(df.loc[:, ['English', 'Math']])
# ⾏切⽚从标签E开始每2个中取⼀个,列标签进⾏切⽚print("----- df.loc['E'::2, 'Chinese':'Math'] -----")print(df.loc['E'::2, 'Chinese':'Math'])
# 选取标量值print("----- df.loc['A', 'Chinese'] -----")print(df.loc['A', 'Chinese'])
""" 输出结果----- df -----   Chinese  Math  EnglishA       64    46      107B      115   104        9C       30    78       27D       30    52       47E      120    38      143F       14    32       22G       63   146      106H       78    22       17I       31    63      147J       26   110       78
----- df.loc[['A', 'C', 'D', 'F']] -----   Chinese  Math  EnglishA       64    46      107C       30    78       27D       30    52       47F       14    32       22
----- df.loc['A':'E', ['Chinese', 'English']] -----   Chinese  EnglishA       64      107B      115        9C       30       27D       30       47E      120      143
----- df.loc[:, ['English', 'Math']] -----   English  MathA      107    46B        9   104C       27    78D       47    52E      143    38F       22    32G      106   146H       17    22I      147    63J       78   110
----- df.loc['E'::2, 'Chinese':'Math'] -----   Chinese  MathE      120    38G       63   146I       31    63
----- df.loc['A', 'Chinese'] -----64"""
5-3.位置选择
xxxxxxxxxximport pandas as pdimport numpy as np
df = pd.DataFrame(data=np.random.randint(0, 150, size=[10, 3]), index=list('ABCDEFGHIJ'),                  columns=['Chinese', 'Math', 'English'])print(df)"""   Chinese  Math  EnglishA      107     3      101B      100     3      108C       75     5       90D      143    86       22E       97    76       22F       80    33       99G      111    60        5H       48   126       60I        7    44       74J       80    99      125"""# ⽤整数位置选择print(df.iloc[4])"""Chinese    97Math       76English    22Name: E, dtype: int32"""
# ⽤整数切⽚,类似NumPyprint(df.iloc[2:8, 0:2])"""   Chinese  MathC       75     5D      143    86E       97    76F       80    33G      111    60H       48   126"""
# 整数列表按位置切⽚print(df.iloc[[1, 3, 5], [0, 2, 1]])"""   Chinese  English  MathB      100      108     3D      143       22    86F       80       99    33"""
# ⾏切⽚print(df.iloc[1:3, :])"""   Chinese  Math  EnglishB      100     3      108C       75     5       90"""
# 列切⽚print(df.iloc[:, :2])"""  Chinese  MathA      107     3B      100     3C       75     5D      143    86E       97    76F       80    33G      111    60H       48   126I        7    44J       80    99"""
# 选取标量值print(df.iloc[0, 2])"""101"""
5-4.boolean索引
xxxxxxxxxximport pandas as pdimport numpy as np
df = pd.DataFrame(data=np.random.randint(0, 150, size=[8, 3]),                  index=list('ABCDEFGH'),                  columns=['Chinese', 'Math', 'English'])
print(df)"""   Chinese  Math  EnglishA      145   115      112B       75   138      146C      110   149        0D      114    78      124E      134    32      111F      112   136      118G       59    39       33H       74   132      145"""
print(df[df.Chinese > 100])"""   Chinese  Math  EnglishA      145   115      112C      110   149        0D      114    78      124E      134    32      111F      112   136      118"""
# 多个条件同时满足使用&符连接print(df[(df.Chinese > 50) & (df['English'] > 50)])"""   Chinese  Math  EnglishA      145   115      112B       75   138      146D      114    78      124E      134    32      111F      112   136      118H       74   132      145"""
# 选择DataFrame中满⾜条件的值,如果满⾜返回值,不满足则返回空数据NaNprint(df[df > 50])"""   Chinese   Math  EnglishA      145  115.0    112.0B       75  138.0    146.0C      110  149.0      NaND      114   78.0    124.0E      134    NaN    111.0F      112  136.0    118.0G       59    NaN      NaNH       74  132.0    145.0"""
# isin判断是否在数组中,返回也是boolean类型值print(df[df.index.isin(['A', 'C', 'F'])])"""   Chinese  Math  EnglishA      145   115      112C      110   149        0F      112   136      118"""
5-5.赋值操作
xxxxxxxxxximport pandas as pdimport numpy as np
df = pd.DataFrame(data=np.random.randint(0, 150, size=[8, 3]),                  index=list('ABCDEFGH'),                  columns=['Chinese', 'Math', 'English'])print(df)"""   Chinese  Math  EnglishA       25   130       34B       41   146       23C       98    53       37D      127   119       64E       19   103      100F      108   146       68G      149   107       40H       36   131      125"""s = pd.Series(data=np.random.randint(0, 150, size=8), index=list('ABCDEFGH'), name='Python')df['Python'] = sprint(df)"""   Chinese  Math  English  PythonA       25   130       34      49B       41   146       23       5C       98    53       37      76D      127   119       64     139E       19   103      100      38F      108   146       68      59G      149   107       40      41H       36   131      125     122"""# 按标签赋值:索引A和科目索引Python赋值df.loc['A', 'Python'] = 256# 按位置赋值df.iloc[3, 2] = 512# 按NumPy数组进⾏赋值df.loc[:, 'Chinese'] = np.array([128] * 8)# 按照where条件进⾏赋值,⼤于等于128变成原来的负数,否则不变df[df >= 128] = -dfprint(df)"""   Chinese  Math  English  PythonA     -128  -130       34    -256B     -128  -146       23       5C     -128    53       37      76D     -128   119     -512    -139E     -128   103      100      38F     -128  -146       68      59G     -128   107       40      41H     -128  -131      125     122"""
6.数据集成
6-1.concat数据串联拼接
xxxxxxxxxximport pandas as pdimport numpy as np
df1 = pd.DataFrame(data=np.random.randint(0, 150, size=[3, 3]),                   index=list('ABC'),                   columns=['Chinese', 'Math', 'English'])df2 = pd.DataFrame(data=np.random.randint(0, 150, size=[3, 3]),                   index=list('DEF'),                   columns=['Chinese', 'Math', 'English'])df3 = pd.DataFrame(data=np.random.randint(0, 150, size=(3, 2)),                   index=list('ABC'),                   columns=['Python', 'Java'])print(df1)"""   Chinese  Math  EnglishA      148   143       47B       16    50       31C      121    75       95"""print(df2)"""   Chinese  Math  EnglishD      120    97       67E       94    99       59F       67    64       78"""print(df3)"""   Python  JavaA      93    28B     110    61C      56    15"""print(pd.concat([df1, df2], axis=0))"""   Chinese  Math  EnglishA      148   143       47B       16    50       31C      121    75       95D      120    97       67E       94    99       59F       67    64       78"""print(df1.append(df2))"""   Chinese  Math  EnglishA      148   143       47B       16    50       31C      121    75       95D      120    97       67E       94    99       59F       67    64       78"""print(pd.concat([df1, df3], axis=1))"""   Chinese  Math  English  Python  JavaA      148   143       47      93    28B       16    50       31     110    61C      121    75       95      56    15"""
6-2.数据插入
xxxxxxxxxximport numpy as npimport pandas as pd
df = pd.DataFrame(data=np.random.randint(0, 151, size=(3, 3)),                  index=list('ABC'),                  columns=['Chinese', 'Math', 'English'])# 插⼊列df.insert(loc=1, column='Python', value=1024)print(df)"""   Chinese  Python  Math  EnglishA       32    1024   103       51B      141    1024   120       62C      148    1024    57       38"""# 注意:# 1.对⾏的操作,使⽤追加append,默认在最后⾯追加,行插入⽆法指定位置# 2.所以想要在指定位置插⼊⾏:切割-> 添加-> 合并
6-3.Join SQL风格合并
数据集的合并(merge)或连接(join)运算是通过⼀个或者多个键将数据链接起来的。这些运算是关系型数据库的核⼼操作。pandas的merge函数是数据集进⾏join运算的主要切⼊点
代码示例1:
xxxxxxxxxximport pandas as pd
df1 = pd.DataFrame(data={'name':                             ['周淑怡', '沫子', '呆妹', '阿冷'], 'weight': [70, 55, 75, 65]})
df2 = pd.DataFrame(data={'name':                             ['周淑怡', '沫子', '呆妹', '阿冷'], 'height': [165, 164, 167, 166]})df3 = pd.DataFrame(data={'名字':                             ['周淑怡', '沫子', '呆妹', '阿冷'], 'height': [165, 164, 167, 166]})
print(df1)"""  name  weight0  周淑怡      701   沫子      552   呆妹      753   阿冷      65"""print(df2)"""  name  height0  周淑怡     1651   沫子     1642   呆妹     1673   阿冷     166"""print(df3)"""    名字  height0  周淑怡     1651   沫子     1642   呆妹     1673   阿冷     166"""data1 = pd.merge(df1, df2,                 how='inner',                 on='name')print(data1)"""  name  weight  height0  周淑怡      70     1651   沫子      55     1642   呆妹      75     1673   阿冷      65     166"""data2 = pd.merge(df1, df3,                 how='outer',                 left_on='name',                 right_on='名字')print(data2)"""  name  weight   名字  height0  周淑怡      70  周淑怡     1651   沫子      55   沫子     1642   呆妹      75   呆妹     1673   阿冷      65   阿冷     166"""
代码示例2:
xxxxxxxxxximport pandas as pdimport numpy as np
df = pd.DataFrame(data=np.random.randint(0, 151, size=(3, 3)),                  index=list('ABC'),                  columns=['Chinese', 'Math', 'English'])print(df)"""   Chinese  Math  EnglishA       38   139       87B      107   127       74C       76    88      102"""score_mean = pd.DataFrame(df.mean(axis=1).round(1), columns=['平均分'])data = pd.merge(left=df, right=score_mean,                left_index=True,                right_index=True)print(data)"""   Chinese  Math  English    平均分A       38   139       87   88.0B      107   127       74  102.7C       76    88      102   88.7"""
7.数据清洗
数据样例:
xxxxxxxxxximport numpy as npimport pandas as pd
df = pd.DataFrame(data={'color':                            ['red', 'blue', 'red', 'green', 'blue', None, 'red'],                        'price': [10, 20, 10, 15, 20, 0, np.NaN]})
print(df)""" color price0 red 10.01 blue 20.02 red 10.03 green 15.04 blue 20.05 None 0.06 red NaN"""- 重复数据删除过滤
xxxxxxxxxximport numpy as npimport pandas as pd
df = pd.DataFrame(data={'color':                            ['red', 'blue', 'red', 'green', 'blue', None, 'red'],                        'price': [10, 20, 10, 15, 20, 0, np.NaN]})
# 判断是否存在重复数据df.duplicated()# 删除重复数据df_new = df.drop_duplicates()print(df_new)"""   color  price0    red   10.01   blue   20.03  green   15.05   None    0.06    red    NaN"""
7-1.空数据删除过滤
xxxxxxxxxximport numpy as npimport pandas as pd
df = pd.DataFrame(data={'color':                            ['red', 'blue', 'red', 'green', 'blue', None, 'red'],                        'price': [10, 20, 10, 15, 20, 0, np.NaN]})
# 判断是否存在空数据,存在返回True,否则返回Falsedf.isnull()# 删除空数据data1 = df.dropna(how='any')print(data1)"""   color  price0    red   10.01   blue   20.02    red   10.03  green   15.04   blue   20.0"""
7-2.空数据填充替换
xxxxxxxxxximport numpy as npimport pandas as pd
df = pd.DataFrame(data={'color':                            ['red', 'blue', 'red', 'green', 'blue', None, 'red'],                        'price': [10, 20, 10, 15, 20, 0, np.NaN]})
# 判断是否存在空数据,存在返回True,否则返回Falsedf.isnull()# 将空数据替换成默认值500data2 = df.fillna(value=500)print(data2)
"""   color  price0    red   10.01   blue   20.02    red   10.03  green   15.04   blue   20.05    500    0.06    red  500.0"""
7-3.筛选指定行或列数据
xxxxxxxxxximport numpy as npimport pandas as pd
df = pd.DataFrame(data={'color':                            ['red', 'blue', 'red', 'green', 'blue', None, 'red'],                        'price': [10, 20, 10, 15, 20, 0, np.NaN]})
# 直接删除某列# del df['color']# print(df)"""   price0   10.01   20.02   10.03   15.04   20.05    0.06    NaN"""# 删除指定列# data1 = df.drop(labels=['price'], axis=1)# print(data1)"""   color0    red1   blue2    red3  green4   blue5   None6    red"""# 删除指定⾏data2 = df.drop(labels=[0, 1, 5], axis=0)print(data2)"""   color  price2    red   10.03  green   15.04   blue   20.06    red    NaN"""
7-4.函数filter使用
xxxxxxxxxximport numpy as npimport pandas as pd
df = pd.DataFrame(np.array(([3, 7, 1], [2, 8, 256])),                  index=['dog', 'cat'],                  columns=['China', 'America', 'France'])print(df)"""     China  America  Francedog      3        7       1cat      2        8     256"""print(df.filter(items=['China', 'France']))"""     China  Francedog      3       1cat      2     256"""# 根据正则表达式删选列标签print(df.filter(regex='a$', axis=1))""" 列索引中以a结尾的数据     China  Americadog      3        7cat      2        8"""# 选择⾏中包含ogprint(df.filter(like='og', axis=0))""" 行索引中包含og关键词     China  America  Francedog      3        7       1"""
7-5.异常值的剔除过滤
xxxxxxxxxximport numpy as npimport pandas as pd
df = pd.DataFrame(data=np.random.randn(10000, 3))# 根据条件找出不满⾜条件数据data = (df > 3 * df.std()).any(axis=1)  # std()标准差# 找出不满⾜条件的⾏索引index = df[data].index# 再根据⾏索引,进⾏数据删除data_new = df.drop(labels=index, axis=0)print(data_new)"""[9943 rows x 3 columns]原数据10000行"""
8.数据转换
8-1.轴和元素替换
xxxxxxxxxximport numpy as npimport pandas as pd
df = pd.DataFrame(data=np.random.randint(0, 10, size=(5, 3)),                  index=list('ABCDE'),                  columns=['Chinese', 'Math', 'English'])print(df)"""   Chinese  Math  EnglishA        3     8        0B        0     2        5C        0     4        1D        1     2        9E        2     2        0"""# 定义指定位置为空数值df.iloc[3, [1, 2]] = Noneprint(df)""" 行索引3,列索引1和2的改为空   Chinese  Math  EnglishA        3   8.0      0.0B        0   2.0      5.0C        0   4.0      1.0D        1   NaN      NaNE        2   2.0      0.0"""# 重命名行与列索引data1 = df.rename(index={'A': 'AAA', 'B': 'BBB'}, columns={'Chinese': '语文'})print(data1)""" 行索引和列索引替换     语文  Math  EnglishAAA   3   8.0      0.0BBB   0   2.0      5.0C     0   4.0      1.0D     1   NaN      NaNE     2   2.0      0.0"""
# 替换值print(df.replace(3, 33333))""" 3替换为33333   Chinese  Math  EnglishA    33333   8.0      0.0B        0   2.0      5.0C        0   4.0      1.0D        1   NaN      NaNE        2   2.0      0.0"""
print(df.replace([0, 7], 777000))""" 将值为0或7替换为777000   Chinese  Math   EnglishA        3   8.0  777000.0B   777000   2.0       5.0C   777000   4.0       1.0D        1   NaN       NaNE        2   2.0  777000.0"""print(df.replace({0: 512, np.nan: 666}))""" 数值为0的值替换为512,空值替换为666   Chinese   Math  EnglishA        3    8.0    512.0B      512    2.0      5.0C      512    4.0      1.0D        1  666.0    666.0E        2    2.0    512.0"""print(df.replace({'Chinese': 0}, -666))""" Chinese列中数值为0的替换为-666   Chinese  Math  EnglishA        3   8.0      0.0B     -666   2.0      5.0C     -666   4.0      1.0D        1   NaN      NaNE        2   2.0      0.0"""
8-2.map Series元素改变
xxxxxxxxxximport numpy as npimport pandas as pd
df = pd.DataFrame(data=np.random.randint(0, 3, size=(5, 3)),                  index=list('ABCDE'),                  columns=['Chinese', 'Math', 'English'])print(df)"""   Chinese  Math  EnglishA        1     0        1B        0     1        0C        1     1        0D        0     2        0E        2     2        2"""# map批量元素改变,Series专有data1 = df['English'].map({0: '低', 1: '中', 2: '高'})print(data1)"""A    中B    低C    低D    低E    高"""data2 = df['Chinese'].map(lambda x: True if x >= 1 else False)print(data2)"""A     TrueB    FalseC     TrueD    FalseE     True"""

def convert(x):    if x == 0:        return "低"    elif x == 1:        return "中"    else:        return "高"

data3 = df['Math'].map(convert)print(data3)"""A    低B    中C    中D    高E    高"""
8-3.apply元素改变
既⽀持Series,也⽀持DataFrame
xxxxxxxxxximport numpy as npimport pandas as pd
df = pd.DataFrame(data=np.random.randint(0, 10, size=(6, 3)),                  index=list('ABCDEF'),                  columns=['语文', '数学', '外语'])print(df)"""   语文  数学  外语A   3    2    5B   6    4    4C   2    8    8D   7    6    4E   1    0    3F   5    1    0"""
data1 = df['外语'].apply(lambda x: True if x > 5 else False)print(data1)"""A    FalseB    FalseC     TrueD    FalseE    FalseF    False"""
# 列的中位数data2 = df.apply(lambda x: x.median(), axis=0)print(data2)"""语文    4.0数学    3.0外语    4.0"""

# ⾏平均值,计数def convert(x):    return x.mean().round(1), x.count()

print(df.apply(convert, axis=1))""" A    (3.3, 3)B    (4.7, 3)C    (6.0, 3)D    (5.7, 3)E    (1.3, 3)F    (2.0, 3)"""
# 计算DataFrame中每个元素print(df.applymap(lambda x: x + 100))""" 每个值增加100    语文   数学   外语A  103  102  105B  106  104  104C  102  108  108D  107  106  104E  101  100  103F  105  101  100"""
8-4.transform变形
xxxxxxxxxximport numpy as npimport pandas as pd
df = pd.DataFrame(data=np.random.randint(0, 10, size=(6, 3)),                  index=list('ABCDEF'),                  columns=['Chinese', 'Math', 'English'])print(df)"""   Chinese  Math  EnglishA        8     6        5B        3     4        4C        7     7        5D        8     7        5E        1     9        6F        2     8        3"""# 单列执⾏多项计算data1 = df['Chinese'].transform([np.sqrt, np.exp])print(data1)"""       sqrt          expA  2.828427  2980.957987B  1.732051    20.085537C  2.645751  1096.633158D  2.828427  2980.957987E  1.000000     2.718282F  1.414214     7.389056"""

def convert_aa(x):    return x + 100

def convert_bb(x):    return x + 200

def convert_cc(x):    return x + 300

# 多列分别执⾏不同的计算data2 = df.transform({'Chinese': convert_aa, 'Math': convert_bb, 'English': convert_cc})print(data2)"""   Chinese  Math  EnglishA      108   206      305B      103   204      304C      107   207      305D      108   207      305E      101   209      306F      102   208      303"""
8-5.重排随机抽样哑变量(虚拟变量)
代码示例1:
xxxxxxxxxximport numpy as npimport pandas as pd
df = pd.DataFrame(data=np.random.randint(0, 10, size=(6, 3)),                  index=list('ABCDEF'),                  columns=['Chinese', 'Math', 'English'])print(df)"""   Chinese  Math  EnglishA        9     8        0B        6     2        1C        4     5        5D        9     8        5E        1     1        3F        6     8        7"""# 获取随机排序数ran = np.random.permutation(6)print(ran)"""[3 0 2 1 5 4]"""# 根据ran获取随机排序数来随机重排DataFramedf1 = df.take(ran)print(df1)"""   Chinese  Math  EnglishD        9     8        5A        9     8        0C        4     5        5B        6     2        1F        6     8        7E        1     1        3"""# 随机抽样print(df.take(np.random.randint(0, 6, size=4)))"""   Chinese  Math  EnglishF        6     8        7D        9     8        5D        9     8        5C        4     5        5"""
代码示例2:
xxxxxxxxxximport pandas as pd
# 哑变量,独热编码,1表示有,0表示没有df = pd.DataFrame({'key': ['b', 'b', 'a', 'c', 'a', 'b']})print(pd.get_dummies(df, prefix='', prefix_sep=''))"""   a  b  c0  0  1  01  0  1  02  1  0  03  0  0  14  1  0  05  0  1  0"""
9.数据重塑
xxxxxxxxxximport numpy as npimport pandas as pd
df1 = pd.DataFrame(data=np.random.randint(0, 100, size=(5, 3)),                   index=list('ABCDE'),                   columns=['Chinese', 'Math', 'English'])print(df1)""" Chinese  Math  EnglishA       93    32       14B       55    79       84C       14    10       36D        4    42       88E       91    81       20"""# 转置print(df1.T)"""          A   B   C   D   EChinese  93  55  14   4  91Math     32  79  10  42  81English  14  84  36  88  20"""df2 = pd.DataFrame(data=np.random.randint(0, 100, size=(10, 3)),                   index=pd.MultiIndex.from_product([list('ABCDE'), ['期中', '期末']]),                   columns=['Chinese', 'Math', 'English'])print(df2)"""      Chinese  Math  EnglishA 期中       80    56       98  期末       86    46       53B 期中       72    81       22  期末       98    99       23C 期中       75    38       91  期末       11    95       28D 期中       98    13       29  期末       46    23       87E 期中        6    33       70  期末       44    30       67"""# ⾏旋转成列,level指定哪⼀层,进⾏变换print(df2.unstack(level=-1))"""       Chinese     Math     English           期中  期末   期中  期末      期中  期末A      80   86     56  46        98  53B      72   98     81  99        22  23C      75   11     38  95        91  28D      98   46     13  23        29  87E       6   44     33  30        70  67"""# 列旋转成⾏print(df2.stack())"""A  期中  Chinese    80       Math       56       English    98   期末  Chinese    86       Math       46       English    53B  期中  Chinese    72       Math       81       English    22   期末  Chinese    98       Math       99       English    23C  期中  Chinese    75       Math       38       English    91   期末  Chinese    11       Math       95       English    28D  期中  Chinese    98       Math       13       English    29   期末  Chinese    46       Math       23       English    87E  期中  Chinese     6       Math       33       English    70   期末  Chinese    44       Math       30       English    67"""# ⾏列互换print(df2.stack().unstack(level=1))"""           期中  期末A Chinese  80  86  Math     56  46  English  98  53B Chinese  72  98  Math     81  99  English  22  23C Chinese  75  11  Math     38  95  English  91  28D Chinese  98  46  Math     13  23  English  29  87E Chinese   6  44  Math     33  30  English  70  67"""# 各学科平均分print(df2.mean())"""Chinese    61.6Math       51.4English    56.8"""# 各学科,每个⼈期中期末平均分print(df2.groupby(level=0).mean())"""   Chinese  Math  EnglishA     83.0  51.0     75.5B     85.0  90.0     22.5C     43.0  66.5     59.5D     72.0  18.0     58.0E     25.0  31.5     68.5"""# 各学科,期中期末所有⼈平均分print(df2.groupby(level=1).mean())"""    Chinese  Math  English期中     66.2  44.2     62.0期末     57.0  58.6     51.6"""
10.数学和统计⽅法
pandas对象拥有⼀组常⽤的数学和统计⽅法。它们属于汇总统计,对Series汇总计算获取mean、max值或者对DataFrame⾏、列汇总计算返回⼀个Series。
10-1.简单统计指标
xxxxxxxxxximport numpy as npimport pandas as pd
df = pd.DataFrame(data=np.random.randint(0, 100, size=(10, 3)),                  columns=['Chinese', 'Math', 'English'])print(df)"""   Chinese  Math  English0       16     4       241       13    78       312       15    79       753       25    18       294       77     6       415       53    32       326        7    37       167       60    61       298       56    76        09       59    39       86"""
# ⾮NA值的数量print(df.count())"""Chinese    10Math       10English    10"""
# 轴0最⼤值,即每⼀列最⼤值print(df.max(axis=0))"""Chinese    77Math       79English    86"""
# 默认计算轴0最⼩值print(df.min())"""Chinese    7Math       4English    0"""
# 中位数print(df.median())"""Chinese    39.0Math       38.0English    30.0"""
# 求和print(df.sum())"""Chinese    381Math       430English    363"""
# 轴1平均值,即每⼀⾏的平均值print(df.mean(axis=1))"""0    14.6666671    40.6666672    56.3333333    24.0000004    41.3333335    39.0000006    20.0000007    50.0000008    44.0000009    61.333333"""
# 分位数print(df.quantile(q=[0.2, 0.4, 0.8]))"""     Chinese  Math  English0.2     14.6  15.6     22.40.4     21.4  35.0     29.00.8     59.2  76.4     47.8"""
# 查看数值型列的汇总各类统计print(df.describe())"""         Chinese       Math    Englishcount  10.000000  10.000000  10.000000mean   38.100000  43.000000  36.300000std    25.304589  29.101355  25.871692min     7.000000   4.000000   0.00000025%    15.250000  21.500000  25.25000050%    39.000000  38.000000  30.00000075%    58.250000  72.250000  38.750000max    77.000000  79.000000  86.000000"""
10-2.索引标签、位置获取
xxxxxxxxxximport numpy as npimport pandas as pd
df = pd.DataFrame(data=np.random.randint(0, 100, size=(5, 3)),                  columns=['Chinese', 'Math', 'English'])print(df)"""   Chinese  Math  English0       50    93       301       53    47       942       64    24       793       76    74       834       55    52        8"""# 计算最⼩值位置 : 0print(df['Chinese'].argmin())# 计算最⼤值位置 : 1print(df['English'].argmax())# 最⼤值索引标签print(df.idxmax())"""Chinese    3Math       0English    1"""# 最⼩值索引标签print(df.idxmin())"""Chinese    0Math       2English    4"""
10-3.更多统计指标
xxxxxxxxxximport numpy as npimport pandas as pd
df = pd.DataFrame(data=np.random.randint(0, 10, size=(12, 3)),                  columns=['Chinese', 'Math', 'English'])
print(df)"""    Chinese  Math  English0         0     3        21         7     8        12         4     3        93         5     5        04         4     5        55         8     0        46         4     1        27         8     0        48         0     0        19         2     7        010        7     2        011        1     8        0"""
# 统计元素出现次数print(df['Chinese'].value_counts())"""4    30    27    28    25    12    11    1"""
# 去重print(df['English'].unique())"""[2 1 9 0 5 4]"""
# 累加print(df.cumsum())"""    Chinese  Math  English0         0     3        21         7    11        32        11    14       123        16    19       124        20    24       175        28    24       216        32    25       237        40    25       278        40    25       289        42    32       2810       49    34       2811       50    42       28"""
# 累乘print(df.cumprod())"""    Chinese  Math  English0         0     3        21         0    24        22         0    72       183         0   360        04         0  1800        05         0     0        06         0     0        07         0     0        08         0     0        09         0     0        010        0     0        011        0     0        0"""# 标准差print(df.std())"""Chinese    2.949063Math       3.060006English    2.741378"""
# ⽅差print(df.var())"""Chinese    8.696970Math       9.363636English    7.515152"""
# 累计最⼩值print(df.cummin())"""    Chinese  Math  English0         0     3        21         0     3        12         0     3        13         0     3        04         0     3        05         0     0        06         0     0        07         0     0        08         0     0        09         0     0        010        0     0        011        0     0        0"""
# 累计最⼤值print(df.cummax())"""    Chinese  Math  English0         0     3        21         7     8        22         7     8        93         7     8        94         7     8        95         8     8        96         8     8        97         8     8        98         8     8        99         8     8        910        8     8        911        8     8        9"""
# 计算差分print(df.diff())"""    Chinese  Math  English0       NaN   NaN      NaN1       7.0   5.0     -1.02      -3.0  -5.0      8.03       1.0   2.0     -9.04      -1.0   0.0      5.05       4.0  -5.0     -1.06      -4.0   1.0     -2.07       4.0  -1.0      2.08      -8.0   0.0     -3.09       2.0   7.0     -1.010      5.0  -5.0      0.011     -6.0   6.0      0.0"""
# 计算百分⽐变化print(df.pct_change())"""     Chinese      Math  English0        NaN       NaN      NaN1        inf  1.666667    -0.502  -0.428571 -0.625000     8.003   0.250000  0.666667    -1.004  -0.200000  0.000000      inf5   1.000000 -1.000000    -0.206  -0.500000       inf    -0.507   1.000000 -1.000000     1.008  -1.000000       NaN    -0.759        inf       inf    -1.0010  2.500000 -0.714286      NaN11 -0.857143  3.000000      NaN"""
10-4.高级统计指标
xxxxxxxxxximport numpy as npimport pandas as pd
df = pd.DataFrame(data=np.random.randint(0, 10, size=(6, 3)),                  columns=['Chinese', 'Math', 'English'])
print(df)"""   Chinese  Math  English0        6     1        81        7     8        52        9     0        43        4     0        34        5     0        55        6     0        5"""
# 属性的协⽅差print(df.cov())"""          Chinese  Math  EnglishChinese  2.966667   1.3      0.2Math     1.300000  10.3      0.6English  0.200000   0.6      2.8"""
# Python和Keras的协⽅差 0.2print(df['Chinese'].cov(df['English']))
# 所有属性相关性系数print(df.corr())"""          Chinese      Math   EnglishChinese  1.000000  0.235175  0.069393Math     0.235175  1.000000  0.111726English  0.069393  0.111726  1.000000"""
# 单⼀属性相关性系数print(df.corrwith(df['Math']))"""Chinese    0.235175Math       1.000000English    0.111726"""
11.数据排序
xxxxxxxxxximport numpy as npimport pandas as pd
df = pd.DataFrame(data=np.random.randint(0, 30, size=(6, 3)),                  columns=['Chinese', 'Math', 'English'])
print(df)"""   Chinese  Math  English0       20    25       131       15     2       182       15    17       273        7    18       214       14    11       245       22    10       21"""# 按索引排序,升序print(df.sort_index(axis=0, ascending=True))
# 按列名排序,降序print(df.sort_index(axis=1, ascending=False))"""   Math  English  Chinese0    25       13       201     2       18       152    17       27       153    18       21        74    11       24       145    10       21       22"""
# 按列名属性值排序print(df.sort_values(by=['Chinese']))"""   Chinese  Math  English3        7    18       214       14    11       241       15     2       182       15    17       270       20    25       135       22    10       21"""# 先按Chinese排序,再按English继续排序print(df.sort_values(by=['Chinese', 'English']))"""   Chinese  Math  English3        7    18       214       14    11       241       15     2       182       15    17       270       20    25       135       22    10       21"""
# 根据属性English排序,返回最⼤10个数据print(df.nlargest(2, columns='English'))"""   Chinese  Math  English2       15    17       274       14    11       24"""
# 根据属性Chinese排序,返回最⼩3个数据print(df.nsmallest(3, columns='Chinese'))"""   Chinese  Math  English3        7    18       214       14    11       241       15     2       18"""
12.分箱操作
- 分箱操作就是将连续数据转换为分类对应物的过程
- 分箱操作分为等距分箱和等频分箱
- 分箱操作也叫⾯元划分或者离散化
xxxxxxxxxximport numpy as npimport pandas as pd
df = pd.DataFrame(data=np.random.randint(0, 150, size=(15, 3)),                  columns=['Chinese', 'Math', 'English'])
# 等宽分箱print(pd.cut(df.Chinese, bins=3))"""0     (76.0, 113.0]1     (76.0, 113.0]2      (39.0, 76.0]3     (76.0, 113.0]4     (1.889, 39.0]5     (76.0, 113.0]6     (76.0, 113.0]7     (1.889, 39.0]8     (76.0, 113.0]9     (1.889, 39.0]10     (39.0, 76.0]11    (76.0, 113.0]12    (1.889, 39.0]13     (39.0, 76.0]14    (76.0, 113.0]"""
# 指定宽度分箱data1 = pd.cut(df.English,               bins=[0, 60, 90, 120, 150],               right=False,               labels=['不及格', '中等', '良好', '优秀'])print(data1)"""0      良好1      良好2     不及格3     不及格4      良好5     不及格6      优秀7      良好8     不及格9      良好10     中等11     中等12     良好13     良好14    不及格"""
# 等频分箱data2 = pd.qcut(df.Chinese, q=4,                labels=['差', '中', '良', '优'])print(data2)"""0     优1     优2     中3     中4     差5     良6     优7     差8     良9     差10    中11    优12    差13    中14    良"""
13.分组聚合
13-1.分组
代码示例1:
xxxxxxxxxximport numpy as npimport pandas as pd
# 准备数据df = pd.DataFrame(data={'sex': np.random.randint(0, 2, size=10),                        'class': np.random.randint(1, 9, size=10),                        'Python': np.random.randint(0, 151, size=10),                        'Keras': np.random.randint(0, 151, size=10),                        'Tensorflow': np.random.randint(0, 151, size=10),                        'Java': np.random.randint(0, 151, size=10),                        'C++': np.random.randint(0, 151, size=10)})
# 将0,1映射成男⼥df['sex'] = df['sex'].map({0: '男', 1: '⼥'})print(df.head(3))"""  sex  class  Python  Keras  Tensorflow  Java  C++0   男      6      33    130          77    87   451   ⼥      6      53    102          62   108   232   ⼥      2     113     83          14    59  119"""
# 1、分组->可迭代对象# 单分组g = df.groupby(by='sex')[['Python', 'Java']]for name, data in g:    print('组名:', name)    print('数据:', data)"""组名: ⼥数据:   sex  class  Python  Keras  Tensorflow  Java  C++1   ⼥      6      53    102          62   108   232   ⼥      2     113     83          14    59  1194   ⼥      4      28     16         115   127   375   ⼥      5      68    149          36    80   318   ⼥      2      67     58         120    60   909   ⼥      2     109    109          49    72    6组名: 男数据:   sex  class  Python  Keras  Tensorflow  Java  C++0   男      6      33    130          77    87   453   男      2     110     47          17    29  1436   男      3     113     24          70    90   787   男      5     141     90          90   133  102"""
"""df.groupby(by=['class', 'sex'])[['Python']] # 多分组df['Python'].groupby(df['class']) # 单分组df['Keras'].groupby([df['class'], df['sex']]) # 多分组df.groupby(df.dtypes, axis=1) # 按数据类型分组"""- 通过字典进⾏分组
xxxxxxxxxximport numpy as npimport pandas as pd
df = pd.DataFrame(data={'sex': np.random.randint(0, 2, size=10),                        'class': np.random.randint(1, 9, size=10),                        'Python': np.random.randint(0, 151, size=10),                        'Keras': np.random.randint(0, 151, size=10),                        'Tensorflow': np.random.randint(0, 151, size=10),                        'Java': np.random.randint(0, 151, size=10),                        'C++': np.random.randint(0, 151, size=10)})
# 通过字典进⾏分组m = {'sex': 'category', 'class': 'category', 'Python': 'IT', 'Keras': 'IT', 'Tensorflow': 'IT', 'Java': 'IT',     'C + +': 'IT'}for name, data in df.groupby(m, axis=1):    print('组名', name)    print('数据', data)"""组名 IT数据    Python  Keras  Tensorflow  Java0      89     59          29    821     150      7         128     42     127     15          25    663      83     67         126    164      83    120         101   1095      29    116          18    876      34     40         123   1377       9     11         105    798      29    117          25   1409      63     33          47    71组名 category数据    sex  class0    0      21    0      82    0      63    0      74    1      55    0      86    1      77    0      78    0      79    1      6"""
13-2.分组聚合
xxxxxxxxxximport numpy as npimport pandas as pd
df = pd.DataFrame(data={'sex': np.random.randint(0, 2, size=10),                        'class': np.random.randint(1, 9, size=10),                        'Python': np.random.randint(0, 151, size=10),                        'Keras': np.random.randint(0, 151, size=10),                        'Tensorflow': np.random.randint(0, 151, size=10),                        'Java': np.random.randint(0, 151, size=10),                        'C++': np.random.randint(0, 151, size=10)})
# 保留1位⼩数print(df.groupby(by='sex').mean().round(1))"""     class  Python  Keras  Tensorflow   Java   C++sex                                               0      3.2    38.8   45.2        94.6  115.0  68.01      2.6    50.4   61.6        88.0   53.0  89.8"""
# 按照班级和性别进⾏分组,Python、Keras的最⼤值聚合print(df.groupby(by=['class', 'sex'])[['Python', 'Keras']].max())"""           Python  Kerasclass sex               1     0        97     95      1        80     632     0        30     473     0        72     63      1       113     455     0       104    1117     1       114     80"""
# 按照班级和性别进⾏分组,计数聚合。统计每个班,男⼥⼈数print(df.groupby(by=['class', 'sex']).size())"""class  sex1      0      12      1      13      1      15      0      16      0      2       1      28      0      2"""
# 基本描述性统计聚合print(df.groupby(by=['class', 'sex']).describe())"""          Python                           ...     C++                                 count   mean        std    min  ...     25%    50%     75%    maxclass sex                                  ...                              1     0      1.0   97.0        NaN   97.0  ...   56.00   56.0   56.00   56.03     0      1.0   73.0        NaN   73.0  ...  134.00  134.0  134.00  134.04     0      2.0   88.0  60.811183   45.0  ...   44.25   69.5   94.75  120.05     1      2.0   61.0  53.740115   23.0  ...  106.50  110.0  113.50  117.06     0      1.0  135.0        NaN  135.0  ...  120.00  120.0  120.00  120.07     1      2.0  109.5  50.204581   74.0  ...   24.75   38.5   52.25   66.08     0      1.0   31.0        NaN   31.0  ...   23.00   23.0   23.00   23.0"""
13-3.分组聚合apply、transform
-
xxxxxxxxxximport numpy as npimport pandas as pd
df = pd.DataFrame(data={'sex': np.random.randint(0, 2, size=300),                        'class': np.random.randint(1, 9, size=300),                        'Python': np.random.randint(0, 151, size=300),                        'Keras': np.random.randint(0, 151, size=300),                        'Tensorflow': np.random.randint(0, 151, size=300),                        'Java': np.random.randint(0, 151, size=300),                        'C++': np.random.randint(0, 151, size=300)})
# 分组后调⽤apply,transform封装单⼀函数计算data1 = df.groupby(by=['class', 'sex'])[['Python', 'Keras']].apply(np.mean).round(1)print(data1)"""           Python  Kerasclass sex               1     0      70.6   66.8      1      76.3   85.62     0      75.8   74.2      1      74.8   72.13     0      83.3   86.9      1      65.5   85.64     0      69.5   70.8      1      76.8   52.15     0      69.7   71.0      1      82.1   53.46     0      79.3   96.7      1      75.9   68.57     0      71.6   88.3      1      63.4   69.88     0      85.7   60.0      1      76.1  100.9
"""

# 最⼤值最⼩值归⼀化def normalization(x):    return (x - x.min()) / (x.max() - x.min())

# 返回全数据,返回DataFrame.shape和原DataFrame.shape⼀样。data2 = df.groupby(by=['class', 'sex'])[['Python', 'Tensorflow']].transform(normalization).round(3)print(data2)"""     Python  Tensorflow0     0.460       0.3531     0.386       0.9252     0.510       0.2553     0.748       0.3414     0.946       0.589..      ...         ...295   0.366       0.627296   0.301       0.310297   0.500       0.883298   0.564       0.837299   0.241       0.294"""
13-4.分组聚合agg

xxxxxxxxxximport numpy as npimport pandas as pd
df = pd.DataFrame(data={'sex': np.random.randint(0, 2, size=300),                        'class': np.random.randint(1, 9, size=300),                        'Python': np.random.randint(0, 151, size=300),                        'Keras': np.random.randint(0, 151, size=300),                        'Tensorflow': np.random.randint(0, 151, size=300),                        'Java': np.random.randint(0, 151, size=300),                        'C++': np.random.randint(0, 151, size=300)})
# agg 多中统计汇总操作# 分组后调⽤agg应⽤多种统计汇总data1 = df.groupby(by=['class', 'sex'])[['Tensorflow', 'Keras']].agg([np.max, np.min, pd.Series.count])print(data1)"""          Tensorflow            Keras                           amax amin count  amax amin countclass sex                                       1     0          150   20    20   146   10    20      1          140   12    18   145    6    182     0          139   21    11   141   45    11      1          132   11    16   150   14    163     0          148   15    16   149   18    16      1          143    0    26   145    1    264     0          148    7    17   144    5    17      1          135    6    17   129    7    175     0          146   31    18   145    0    18      1          139   33    17   144   17    176     0          148    3    23   144    4    23      1          141    2    27   147    0    277     0          125    1    19   149    6    19      1          140    4    21   142    0    218     0          126    2    16   127    7    16      1          135    1    18   148    8    18"""
# 分组后不同属性应⽤多种不同统计汇总data2 = df.groupby(by=['class', 'sex'])[['Python', 'Keras']].agg({'Python': [('最⼤值', np.max), ('最⼩值', np.min)],                                                                  'Keras': [('计数', pd.Series.count),                                                                            ('中位数', np.median)]})print(data2)"""          Python     Keras                    最⼤值 最⼩值    计数    中位数class sex                        1     0      149  13    20   78.0      1      119   4    18  103.02     0      131   1    11  100.0      1      144   0    16   57.03     0      148   8    16   87.0      1      146   1    26   85.54     0      149   3    17   73.0      1      148   2    17   48.05     0      148  14    18   79.5      1      139   7    17   74.06     0      150   1    23   87.0      1      146   0    27  103.07     0      148   3    19   99.0      1      146   0    21   69.08     0      142  18    16   75.5      1      150   1    18   56.0"""
13-5.透视表pivot_table
xxxxxxxxxximport numpy as npimport pandas as pd
df = pd.DataFrame(data={'sex': np.random.randint(0, 2, size=300),                        'class': np.random.randint(1, 9, size=300),                        'Python': np.random.randint(0, 151, size=300),                        'Keras': np.random.randint(0, 151, size=300),                        'Tensorflow': np.random.randint(0, 151, size=300),                        'Java': np.random.randint(0, 151, size=300),                        'C++': np.random.randint(0, 151, size=300)})

# 透视表def count(x):    return len(x)

# 要透视分组的值data = df.pivot_table(values=['Python', 'Keras', 'Tensorflow'],                      index=['class', 'sex'],                      aggfunc={'Python': [('最⼤值', np.max)],                               'Keras': [('最⼩值', np.min), ('中位数', np.median)],                               'Tensorflow': [('最⼩值', np.min), ('平均值', np.mean), ('计数', count)]})print(data)"""           Keras       Python Tensorflow                         中位数   最⼩值    最⼤值        平均值   最⼩值    计数class sex                                           1     0     98.0  26.0    147  52.347826   4.0  23.0      1     50.0   4.0    126  89.562500   5.0  16.02     0     65.0   0.0    148  62.956522   0.0  23.0      1     91.0   9.0    146  84.850000  19.0  20.03     0     61.0   1.0    135  75.260870   6.0  23.0      1     85.0   2.0    139  44.250000   1.0  16.04     0     88.0   5.0    150  76.866667   6.0  15.0      1    101.0  20.0    142  76.125000   6.0  16.05     0    104.5   7.0    150  80.200000   1.0  20.0      1     55.0   1.0    150  77.238095  28.0  21.06     0     69.5   1.0    148  96.318182  31.0  22.0      1     81.0  16.0    138  74.800000  19.0  15.07     0     69.5   0.0    150  76.136364   2.0  22.0      1     67.0   2.0    141  56.142857   2.0  14.08     0     60.5   3.0    142  75.687500  10.0  16.0      1     72.5   5.0    135  79.111111   4.0  18.0"""
14.时间序列
14-1.时间戳操作
xxxxxxxxxximport numpy as npimport pandas as pd
# 时刻数据 2022-12-07 10:00:00print(pd.Timestamp('2022-12-07 10'))  # 2022-12-07 10:00:00
# 时期数据print(pd.Period('2022-12-07 10:08:08', freq='Y'))  # 2022print(pd.Period('2022-12-07 10:08:08', freq='M'))  # 2022-12print(pd.Period('2022-12-07 10:08:08', freq='D'))  # 2022-12-07print(pd.Period('2022-12-07 10:08:08', freq='H'))  # 2022-12-07 10:00
# 批量时刻数据index = pd.date_range('2022.12.07', periods=5, freq='M')print(index)"""'2022-12-31', '2023-01-31', '2023-02-28', '2023-03-31','2023-04-30'"""
# 批量时期数据print(pd.period_range('2022.12.07', periods=5, freq='M'))"""'2022-12', '2023-01', '2023-02', '2023-03', '2023-04'"""
# 时间戳索引Seriesindex_info = pd.date_range('2022.12.07', periods=5, freq='D')ts = pd.Series(np.random.randint(0, 10, size=5), index=index_info)print(ts)"""2022-12-07    42022-12-08    72022-12-09    42022-12-10    52022-12-11    1"""
# 转换⽅法print(pd.to_datetime(['2022.12.07', '2022-12-07', '07/12/2022', '2022/12/07']))"""'2022-12-07', '2022-12-07', '2022-07-12', '2022-12-07'"""
print(pd.to_datetime([1670582232], unit='s'))  # 2022-12-09 10:37:12
# 世界标准时间dt = pd.to_datetime([1670582232401], unit='ms')print(dt)  # 2022-12-09 10:37:12.401000
# 东⼋区时间print(dt + pd.DateOffset(hours=8))  # 2022-12-09 18:37:12.401000
# 3天后⽇期print(dt + pd.DateOffset(days=3))  # 2022-12-12 10:37:12.401000
14-2.时间戳索引
xxxxxxxxxximport pandas as pd
index = pd.date_range("2022-12-05", periods=200, freq="D")ts = pd.Series(range(len(index)), index=index)
# ⽇期访问数据: 3print(ts['2022-12-08'])
# ⽇期切⽚print(ts['2022-12-08':'2022-12-10'])"""2022-12-08    32022-12-09    42022-12-10    5"""
# 传⼊年⽉print(ts['2022-12'])print(ts['2022'])"""2022-12-05     02022-12-06     12022-12-07     2...2022-12-29    242022-12-30    252022-12-31    26"""
# 时间戳索引 : 3print(ts[pd.Timestamp('2022-12-08')])
# 切⽚print(ts[pd.Timestamp('2022-12-08'):pd.Timestamp('2022-12-08')])"""2022-12-08    3"""print(ts[pd.date_range('2022-12-08', periods=10, freq='D')])"""2022-12-08     32022-12-09     42022-12-10     52022-12-11     62022-12-12     72022-12-13     82022-12-14     92022-12-15    102022-12-16    112022-12-17    12"""
# 获取年print(ts.index.year)"""[2022, 2022, 2022, 2022, 2022, 2022, 2022, 2022, 2022, 2022,            ...            2023, 2023, 2023, 2023, 2023, 2023, 2023, 2023, 2023, 2023]"""# 获取星期⼏print(ts.index.dayofweek)"""[0, 1, 2, 3, 4, 5, 6, 0, 1, 2,            ...            1, 2, 3, 4, 5, 6, 0, 1, 2, 3]"""
# ⼀年中第⼏个星期⼏print(ts.index.weekofyear)"""[49, 49, 49, 49, 49, 49, 49, 50, 50, 50,            ...            24, 24, 24, 24, 24, 24, 25, 25, 25, 25]"""
15.数据可视化
安装工具:
xxxxxxxxxxpip install matplotlib -i https://pypi.tuna.tsinghua.edu.cn/simplepip install jupyter -i https://pypi.tuna.tsinghua.edu.cn/simple
Matplotlib 是 Python 的绘图库,它能让使用者很轻松地将数据图形化,并且提供多样化的输出格式,Matplotlib 可以用来绘制各种静态,动态,交互式的图表。Matplotlib 是一个非常强大的 Python 画图工具,我们可以使用该工具将很多数据通过图表的形式更直观的呈现出来。Matplotlib 可以绘制线图、散点图、等高线图、条形图、柱状图、3D 图形、甚至是图形动画等等
Jupyter Notebook是一款开发工具,基于网页的用于交互计算的应用程序。其可被应用于全过程计算:开发、文档编写、运行代码和展示结果,经常可以大大增加调试代码效率,快速的展现数据输出结果和图像。
Jupyter启动命令行终端
- Windows----> 快捷键:win + R ----->输⼊:cmd回⻋------>命令⾏出来
- Mac ---->启动终端
命令行终端中启动jupyter
进⼊终端输⼊指令:jupyter notebook
[注意]:在哪⾥启动jupyter启动,浏览器上的⽬录,对应哪⾥
线形图
xxxxxxxxxximport numpy as npimport pandas as pddf1 = pd.DataFrame(data=np.random.randn(1000, 4), index=pd.date_range(start='27/6/2012', periods=1000), columns=list('ABCD'))df1.cumsum().plot()
条形图
xxxxxxxxxxdf2 = pd.DataFrame(data=np.random.rand(10, 4), columns=list('ABCD'))df2.plot.bar(stacked=True)
饼图
xxxxxxxxxxdf3 = pd.DataFrame(data=np.random.rand(4, 2), index=list('ABCD'), columns=['One', 'Two'])df3.plot.pie(subplots=True, figsize=(8, 8))
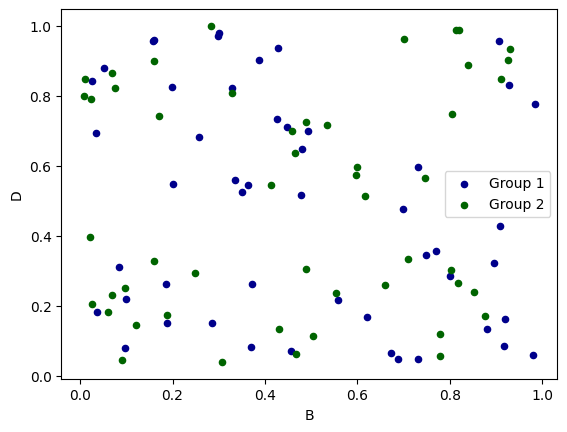
散点图
xxxxxxxxxxdf4 = pd.DataFrame(np.random.rand(50, 4), columns=list('ABCD'))df4.plot.scatter(x='A', y='B')ax = df4.plot.scatter(x='A', y='C', color='DarkBlue', label='Group 1')df4.plot.scatter(x='B', y='D', color='DarkGreen', label='Group 2', ax=ax)df4.plot.scatter(x='A', y='B', s=df4['C'] * 200)

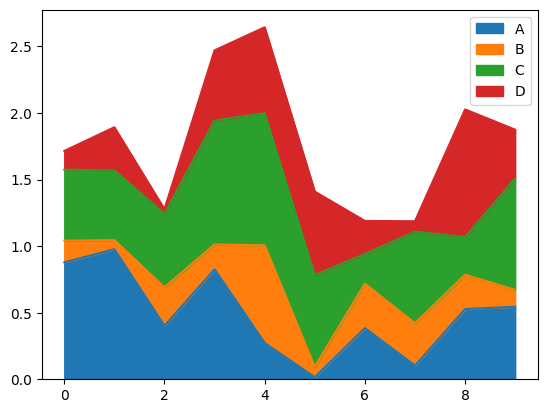
面积图
xxxxxxxxxxdf5 = pd.DataFrame(data=np.random.rand(10, 4), columns=list('ABCD'))df5.plot.area(stacked=True)
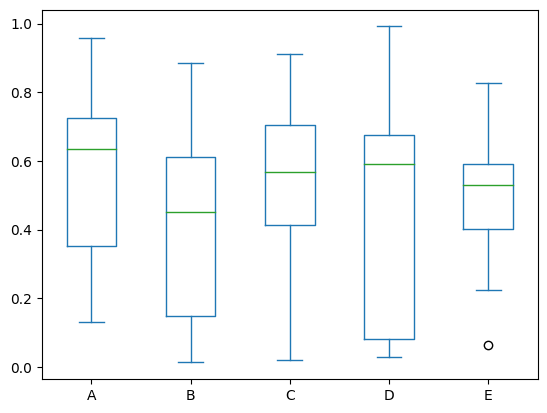
箱式图
xxxxxxxxxxdf6 = pd.DataFrame(data=np.random.rand(10, 5), columns=list('ABCDE'))df6.plot.box()
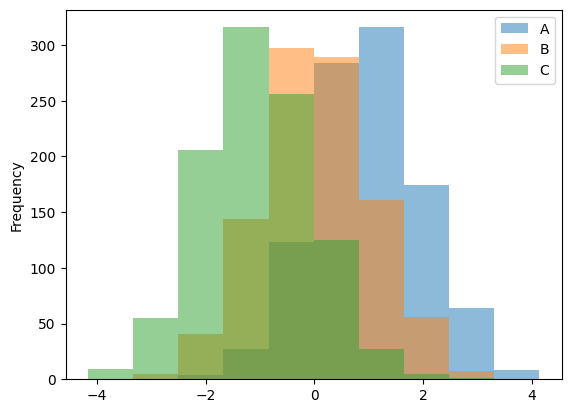
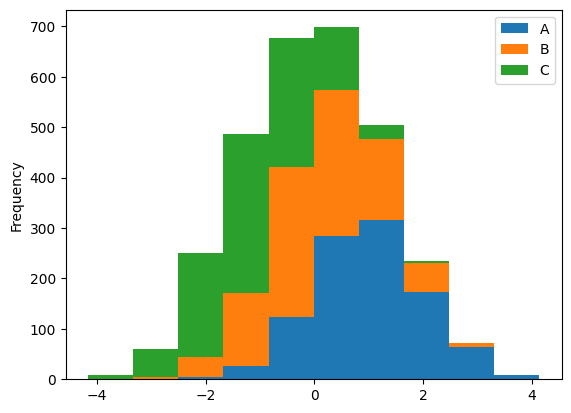
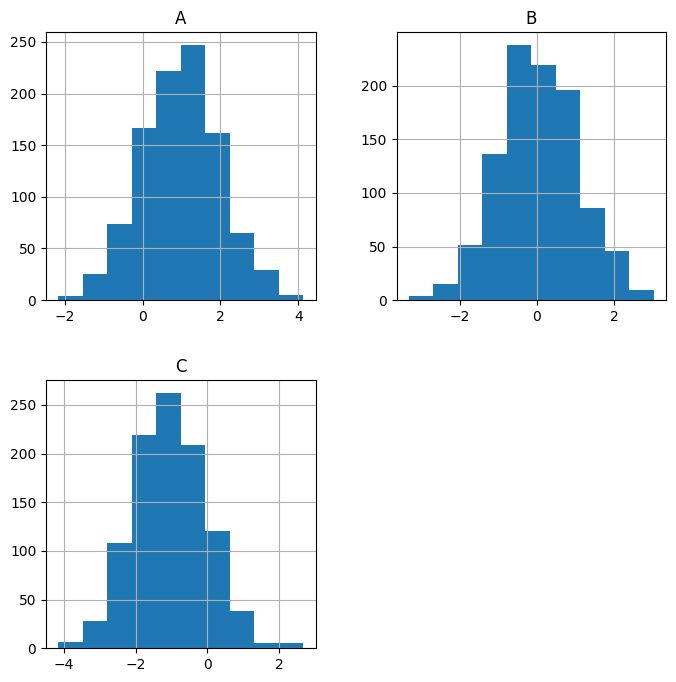
直方图
xxxxxxxxxxdf7 = pd.DataFrame({'A': np.random.randn(1000) + 1, 'B': np.random.randn(1000), 'C': np.random.randn(1000) - 1})df7.plot.hist(alpha=0.5)df7.plot.hist(stacked=True)df7.hist(figsize=(8, 8))